
Bitcoin four-year cycle: no change in pattern, no change in play
Bottoms up in 2026, topdown in 2029?

It's all right
Photo by Yulya, used with permission
Is the four-year cycle of bitcoin still working? This was the most predictable collapse in the history of encrypted currency, yet none was prepared。
At the peak of the cattle market in 2025, one of the most common arguments in the area of encryption was that the four-year cycle had already passed, that entry had changed everything and that the old rule no longer applied. However, bitcoin almost reached its peak, then fell by 50 per cent, and is now projecting its place in the cyclical framework. So let us talk frankly about what really happened。
The four-year cycle is not dead. The buyers are different
THROUGHOUT 2024 AND EARLY 2025, THE ENCRYPTION MARKET HAS BEEN FULL OF NARRATIVES THAT BITCOIN ETF HAS CHANGED EVERYTHING, INSTITUTIONS ARE BUYING, AND FOUR-YEAR CYCLES DRIVEN BY HALVING AND THE DIASPORA ARE NO LONGER APPLICABLE. IT'S A SUPER CYCLE, BEAR CITY WON'T COME AGAIN。
That reason sounds convincing. Bitcoin had reached an unprecedented high before halving it. ETF inflows broke record. Michael Saylor is buying billions of bitcoins a week. For the first time, the mainstream financial media also reported bitcoin as a compliance asset category. The whole market atmosphere gave the impression that the old rules no longer existed。
However, bitcoin hit the peak of $126,296 on October 6, 2025, and then started falling. The price has now dropped by about 50 per cent from its high point, the index of fear and greed is in a state of extreme fear, and there is a dead end in the chart. The cycle, which is considered dead, is taking place as precisely as in 2013, 2017 and 2021。
The cycle is not dead, it is just becoming more hidden. The reason why it has become hidden, that is, why no one has foreseen the top, why no single top indicator has warned, is the most important point that we understand where we are and where we are going。
But before we go into this point, we need to know what the cycle is and why it lasts for more than a decade. Because those who deny the cycle are not all wrong. Markets have indeed changed, except that cycles have not been broken, but have changed with them。
Every four years, a halving event reduces the number of bitcoins in new output by 50 per cent. Miners are the largest and most sustainable sellers of bitcoin, and they dig up and sell it to cover operating costs. When halving their production cuts by half, the amount of bitcoin sold to the market on a daily basis falls dramatically. If demand remained constant or increased, prices would eventually rise. This is the fundamental mechanism for price fluctuations in bitcoin, which is not a theory, but a supply-demand relationship。
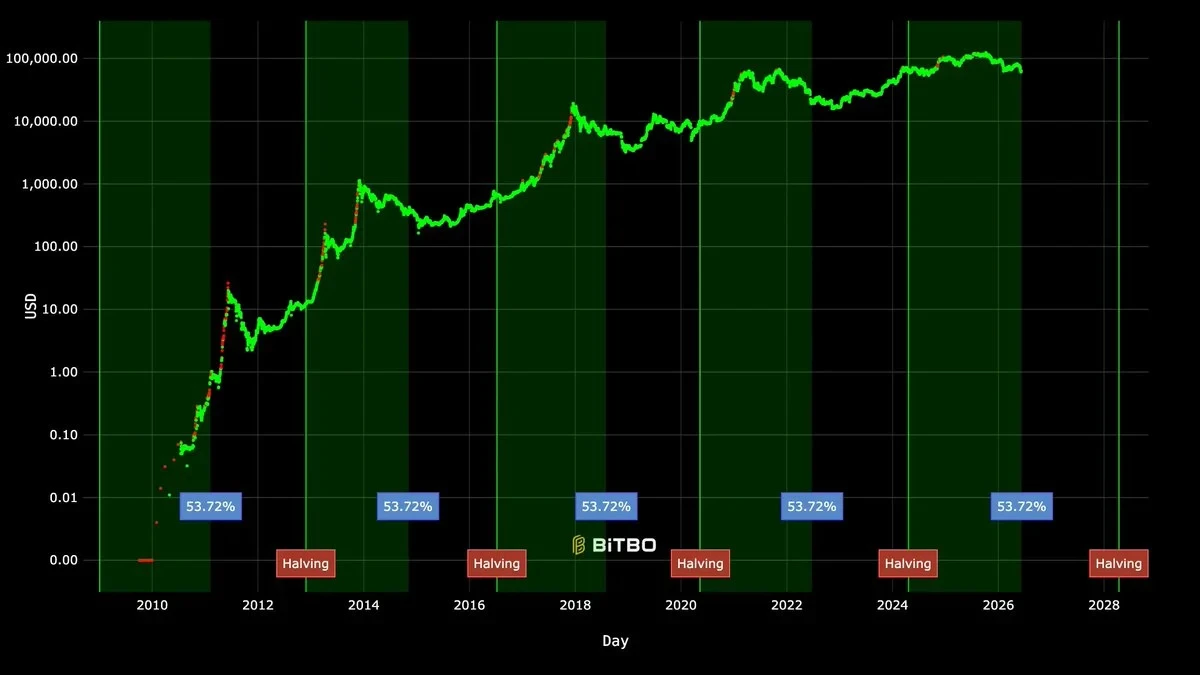
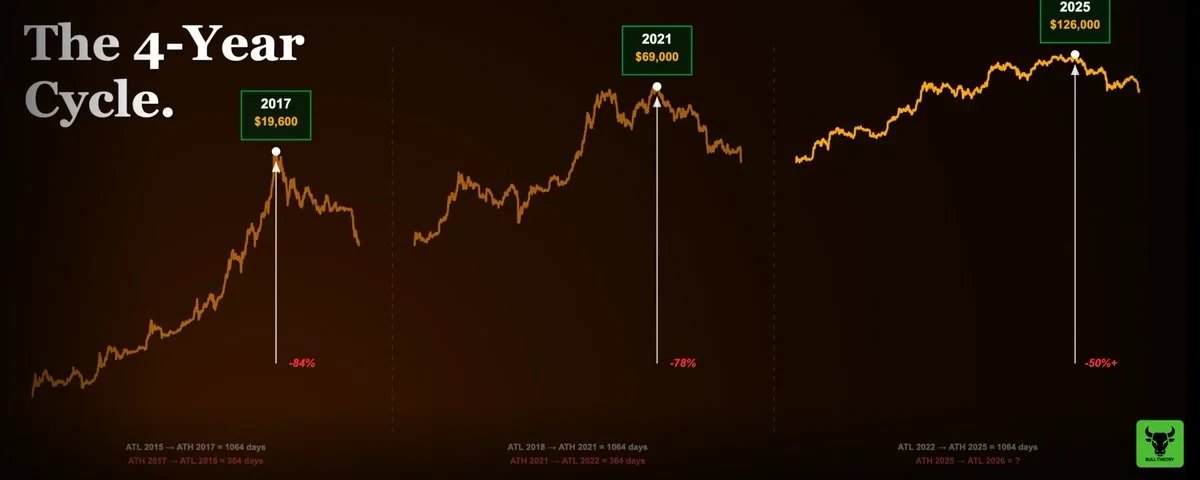
Looking back at successive halves since 2012, the conversion of bitcoin prices is repeated without exception。
FOUR CYCLES, FOUR HALVES. EACH OF THESE BASIC STRUCTURES IS THE SAME. AND THAT'S WHAT THOSE WHO CLAIM TO BE DEAD IGNORE: CYCLES DON'T CARE ABOUT NARRATIVES. IT OPERATES ON A SUPPLY-AND-DEMAND MECHANISM THAT DOES NOT CHANGE SIMPLY BECAUSE THE AGENCY STARTS BUYING THROUGH ETF. HALVE IN APRIL 2024. BITCOIN HIT THE TOP ON OCTOBER 6, 2025, 535 DAYS LATER. THIS FALLS RIGHT AFTER HALVING EACH PREVIOUS CYCLE, BETWEEN 480 AND 550 DAYS OF HISTORIC WINDOW。
The cycle never dies. It just looks different on the face because the buyers are different. This difference: institutional demand replaces dispersed demand is why no top indicator is triggered, and why most people who focus on top signals simply miss the top。
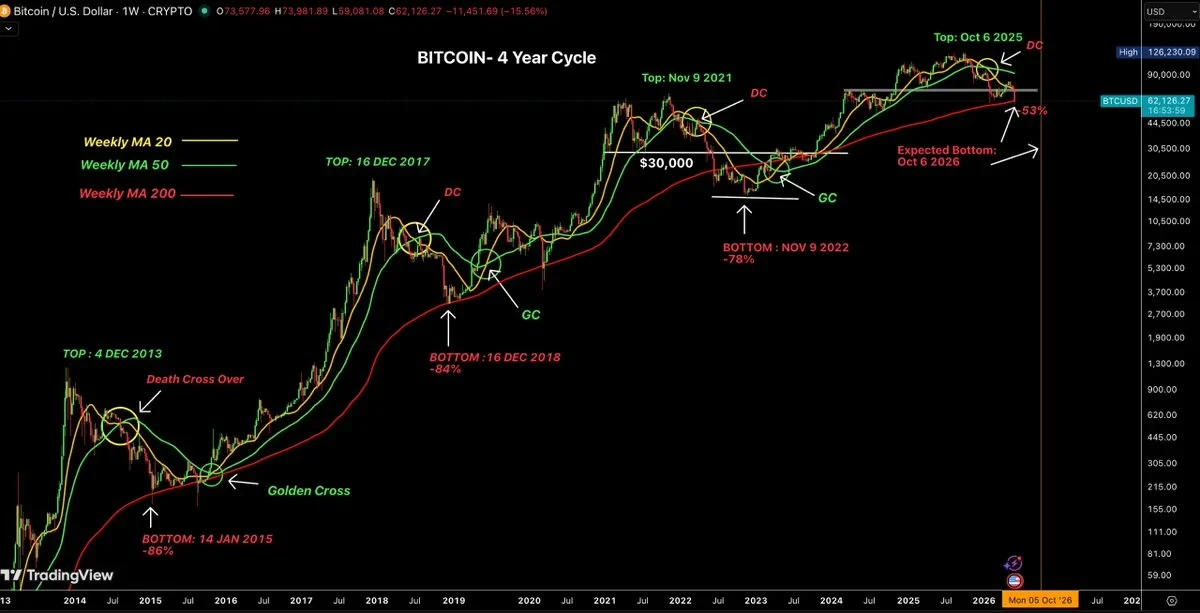
Track these four bitcoin cycles and record the top, bottom, fork, fork and 200 weeks of moving average lines
There is also a stable pattern in these cycles that does not receive sufficient attention: the bottom is always around a year after the top. Although not exactly a year, the scope is strikingly tight. After the peak in 2013, the bottom came in 410 days. After 2017 it was 363 days. After 2021 it was 376 days. If this rhythm is still in place, then the bottom of the current cycle will fall between the end of September 2026 and mid-November。

THERE IS ALSO A CLEAR TREND IN DROP DATA: 86 PER CENT, 84 PER CENT, 78 PER CENT, WHICH IS NOW LIKELY TO BE 50 TO 65 PER CENT. EVERY TIME BEAR CITY IS LIGHTER THAN LAST TIME. THIS IS NOT A COINCIDENCE. IT REFLECTS A MATURE ASSET: IT NOW HAS INSTITUTIONAL BUYERS WHO DO NOT SELL IN A PANIC, A REGULATED ETF MARKET THAT CREATES STRUCTURAL DEMAND, AND A BUSINESS THAT HOLDS BITCOIN AS A CAPITAL RESERVE ON ITS BALANCE SHEET. AS BUYERS MATURE, VOLATILITY IS BEING REDUCED。
THIS CYCLE HAS ALSO SEEN AN UNPRECEDENTED INCREASE IN BITCOIN'S RECORD BEFORE HALVING IT. IN MARCH 2024, EXACTLY A MONTH BEFORE IT WAS HALVED ON APRIL 20, BITCOIN REACHED $73,581, BREAKING THE HISTORICAL HIGH OF $69,000 CREATED IN 2021. THIS IS A NEW HISTORICAL HIGH, BUT NOT THE TOP OF THE CYCLE. EACH OF THE PREVIOUS CYCLES EVENTUALLY PEAKED A FEW MONTHS AFTER HALVING — THIS TIME, NO EXCEPTION — THE REAL CYCLE ENDED AT $126,296 ON 6 OCTOBER 2025, WELL AFTER HALVING IN APRIL 2024. THE DIFFERENCE IS THAT IT NEVER HAPPENED BEFORE THE REDUCTION OF THE LEVEL OF ITS HISTORY. THIS IS DUE TO THE APPROVAL OF THE SPOT BITCOIN ETF IN JANUARY 2024, WHICH BROUGHT INSTITUTIONAL DEMAND INTO THE MARKET BEFORE HALVING IT, PUTTING THE CYCLE IN THE VANGUARD OF TIME, WHICH PUZZLES MANY WHO TRACK THE TIME AFTER NORMALLY HALVING。
What's wrong with the cycle
To understand why Bitcoin is at the top without any common signals, you have to understand what happened to the bulk money in the 18 months before it hit. In short, most of the diaspora funds were depleted before Bitcoin reached $126,000。
IN PREVIOUS BITCOIN COWS, THE DIASPORA HAS PLAYED A SPECIFIC ROLE. THEY PROVIDED THE LAST FUEL AND CREATED THE LAST CARNIVAL AND PARABOLIC BOOM. IT WAS THE DIASPORA'S FOMO MOOD THAT PUSHED BITCOIN FROM A REASONABLE PRICE TO AN EXTREME PRICE AT THE END OF EACH CYCLE. AND THAT'S WHY THE TOP INDICATOR WAS TRIGGERED. THOSE TOOLS WERE ORIGINALLY DESIGNED TO MEASURE THE BEHAVIOUR OF THE DIASPORA RATHER THAN THE BEHAVIOUR OF INSTITUTIONS. THERE ARE NO INDICATORS TO TRIGGER WITHOUT SCATTERED FANATICISM。
During this cycle, the bulk never appeared in Bitcoin on a scale. This is not because they were not involved in the encryption market, they were involved, but they were "raised" elsewhere。
The Memecoin Mobility Trap
The greatest factor in destroying the mobility of the diaspora during this cycle is the fact that the creation and distribution of Memecoin became extremely easy. The platform for issuing tokens (especially on Solana) allows anyone to issue a token at almost zero cost in a few minutes. By mid-2025, the total number of tokens had jumped from about 10,000 to 20,000 at the peak of 2021 to over 10 million。
THINK OF WHAT THIS MEANS FOR A SCATTERED INVESTOR TRYING TO FIND OUT IN THIS MARKET. IN 2021, YOU HAD ABOUT 200 TOKENS WORTH SERIOUS CONSIDERATION. THEY ARE REAL PROJECTS WITH USERS, INCOME OR AT LEAST A RELIABLE TEAM AND PRODUCT ROAD MAP. THE PATH FROM "I WANT TO INVEST IN ENCRYPTED MONEY" TO "I BUY ETH AND SOL" IS VERY BRIEF AND OBVIOUS. THAT'S WHERE THE BULK MONEY IS CONCENTRATED, AND THAT'S WHY ETH CAN GO UP TO $4,800 AND SOL CAN GO UP TO $260。

But in 2025, you have to choose out of 10 million options. Most of these tokens were designed for one purpose: The funds are extracted from the bulk buyers and transferred to the insiders as soon as possible. The method of operation is not complicated: creating a token, creating man-made sex, selling it when it is bought by the diaspora, and then taking off. This practice is repeated thousands of times a day throughout the ecosystem。
The number of options faced by bulk investors in 2021 is manageable, and most are legal projects. In 2025, the bulk investors faced millions of options, most of which were structured to harvest their funds. The result is understandable: the bulk of the money entered the encrypted market in 2025, but most of it never went to bitcoin or high-quality banknotes, but was the first to be sucked by Memecoin interests。
The involvement of influential public figures further magnifies the problem. Many high-profile figures, including in the political, entertainment and social media fields, introduced their own Memecoin during the cycle. Each time, the pattern is the same: a coin with the name of a celebrity is distributed in a huge job, the bulky expects to buy and buy with fame to make money, and the insiders and early holders sell it. The token fell in days or weeks by 80 to 95 per cent. The bulk has only a worthless token, the value of which is only a fraction of what they buy。
This happened over and over again throughout 2024 and 2025. Every time it occurs, a large bulk of the mobility of an ecosystem is permanently wiped out. Those who lost money in those projects did not turn around with the rest of the money to buy bitcoin, either they left the market completely or they no longer had any money to invest。
HIGH VC CURRENCY FDV AND LOW CIRCULATION
The second major factor in the destruction of the diaspora is the distribution structure of new coins for the cycle. This is less discussed, but equally devastating。
IN 2021, NEW ENCRYPTION PROJECTS ARE USUALLY ONLINE AT 100 MILLION TO 1 BILLION UNITED STATES DOLLARS IN COMPLETELY DILUTED VALUATION (FDV). THIS LEAVES REAL ROOM FOR RISE FOR BUYERS IN OPEN MARKETS. A $200 MILLION FDV ON LINE AND GROWING TO $2 BILLION COULD YIELD A 10-FOLD RETURN TO THE DIASPORA. THIS IS THE MEMORY OF 2021 -- THE STORY OF "I BOUGHT THIS COIN EARLIER AND TURNED $5,000 INTO $50,000."。
DURING THIS CYCLE, THE STRUCTURE CHANGED COMPLETELY. THE VENTURE CAPITAL FUND RAISED BILLIONS OF DOLLARS IN 2021 AND 2022 TO INVEST IN ENCRYPTION INFRASTRUCTURE. BY 2024 AND 2025, THEIR PORTFOLIO COMPANIES WERE READY TO ISSUE TOKENS, AND VCS NEEDED TO SHOW THEIR LIMITED PARTNER (LP) RETURNS. AS A RESULT, THE PROJECT STARTED TO GO ONLINE AT $5 BILLION, $10 BILLION OR EVEN $20 BILLION, WHILE THE ACTUAL FLOW OF SUPPLIES ON THE FIRST DAY WAS BETWEEN 5 AND 15 PER CENT。
WHAT DOES THAT MEAN IN REALITY: THE DIASPORA SEES A TOKEN THAT LOOKS LIKE $500 MILLION IN MARKET VALUE TRANSACTIONS AND SEES ROOM FOR INCREASE. BUT THE REAL TOTAL DILUTION UNDER THIS PRICE IS $10 BILLION, AND 85% OF THE COINS LIE IN VC'S WALLET, WAITING TO BE UNLOCKED WITHIN THE NEXT TWO TO FOUR YEARS. EVERY MONTH, MORE COINS ARE UNLOCKED AND SOLD. PRICES FACE STRUCTURAL CEILINGS, AS SUPPLY PRESSURES NEVER CEASE. THE BULK BUYERS ARE ACTUALLY BUYING A CONTINUOUS SALE THAT THEY DO NOT KNOW ABOUT。
Following an independent study of 118 tokens issued in 2025, 84.7 per cent of the currency transaction price was lower than its published valuation, with the median price falling by 71 per cent. These are not unheard of projects, many of which are listed on large exchanges with large marketing budgets and media exposure. But they still lose much of their value, because the economics of tokens were originally intended to benefit their own people at the expense of public buyers。
The common consequence of the release of the Memecoin and the high FDV VC project is that, before Bitcoin was near the top of its cycle, the bulk of the encrypted funds were destroyed on a large scale. By October 2025, most of the bulky participants who had entered the market in 2024 had either lost their lives or left the field completely. There is no more remaining liquidity to rotate to bitcoin. And there is no FOMO wave anymore. The fuel that drove the last violent top no longer exists。
Where should the money go
The cycle of 2021 worked because there was a clear path for the diaspora to buy bitcoin, bitcoin, and soar, and soar, and soar, soar, and soar, soar, and soar, soar, and soar, soar and soar. Funds are dumped downwards in a predictable market value chain, with returns on each layer。
But in 2025, this waterfall effect never opened. The large-scale purchase of bitcoin by the diaspora never happened, and their funds were exhausted. The market value of bitcoin has remained above 60 per cent during almost the entire cattle market. In September 2025, the mountain season index peaked at 78 per cent in about three weeks, and immediately collapsed. There was only a short window period in which the currency performed better than bitcoin, and then the share of bitcoin quickly recovered to over 60%。
The expected season was not due to market miscalculation, but to the mechanisms that created it: diaspora funds were no longer working down the market value chain. The money has long been drained。
How have institutions changed the structure of the cycle
Just as the bulk of the money was lost in the distribution of Memecoin and VC tokens, something completely new was happening to Bitcoin. This was the first time in the history of the asset that a regulated institutional product injected billions of dollars into bitcoin in accordance with a structured and sustained timetable。
THE APPROVAL OF THE JANUARY 2024 SPOT BITCOIN ETF WAS MORE THAN JUST A HEADLINE. IT FUNDAMENTALLY CHANGED THE MARGINAL BUYER GROUP OF BITCOIN, AND THAT CHANGE RESULTED IN A SERIES OF CHAIN REACTIONS, LEADING TO A DIFFERENT CYCLE。
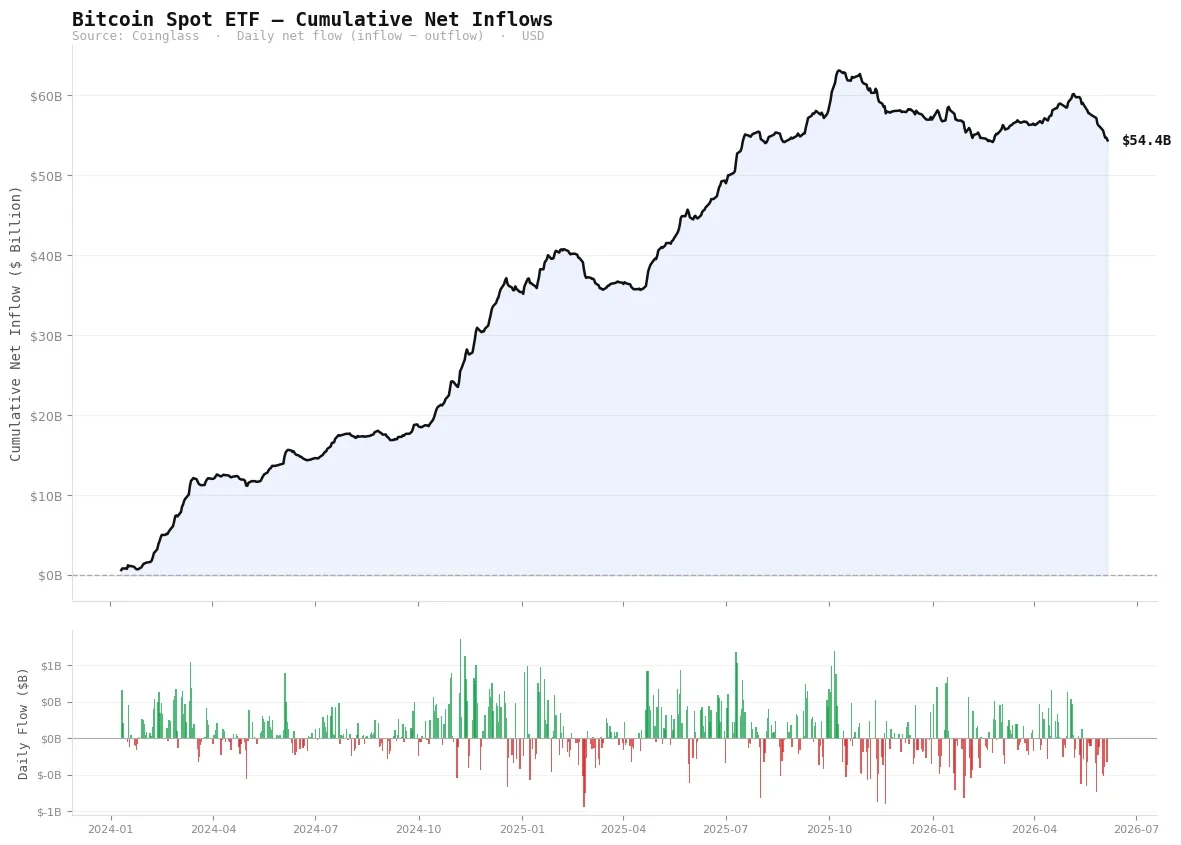
The accumulated net inflows of Bitcoin-based ETF peaked at $63.1 billion in October 2025 and are currently at $54.4 billion (data source: Coinglass)。
FROM JANUARY 2024 TO OCTOBER 2025, SPOT BITCOIN ETF RECEIVED A CUMULATIVE NET INFLOW OF $63 BILLION. AT PEAK, AVERAGE DAILY INFLOWS EXCEEDED $350 MILLION, WHICH IS BETWEEN 8 AND 9 TIMES MORE THAN THE VALUE OF THE NEW OUTPUT OF MINERS PER DAY THAN IN TT$. ON THE MAXIMUM SINGLE DAY OF THE INFLOW, THERE WAS AN INFLUX OF OVER $1 BILLION IN ONE TRADING DAY。
These are not bulk investors. They are pension funds, registered investment advisers, family offices, endowment funds and hedge funds that make asset allocation decisions at a quarterly pace. They won't check the price of bitcoin in the middle of the night. They won't have FOMO emotions because of a green K line on X (twitter). They accepted an asset allocation mandate and carried out it systematically in weeks to months。
WHEN THIS TYPE OF BUYER BECOMES THE DOMINANT FORCE OF THE MARKET, THE PRICE MOVEMENT APPEARS TO BE COMPLETELY DIFFERENT FROM THAT OF THE DISPERSED MARKET. YOU WILL NO LONGER SEE A LONG RIMWORK FOLLOWED BY AN EXPLOSIVE VERTICAL UPLIFT, REPLACING IT WITH A SLOW AND LASTING CLIMB. THERE'S NO MORE PARABOLIC K-LINES, BUT INSTEAD THERE'S A STEADY UPWARD TREND THAT DOESN'T SEEM EXCITING, BUT THERE'S A HUGE INCREASE IN TIME。
Bitcoin rose from $40,000 in January 2024 to $126,000 in October 2025, reaching 215 per cent. If, in any previous cycle, such an increase would necessarily include a rise of up to 30 per cent or 40 per cent in one week. In the current cycle, however, the weekly increase appears to be moderate by historical standards. While the overall increase is significant, it comes in a way that makes people feel organized and even boring rather than explosive。
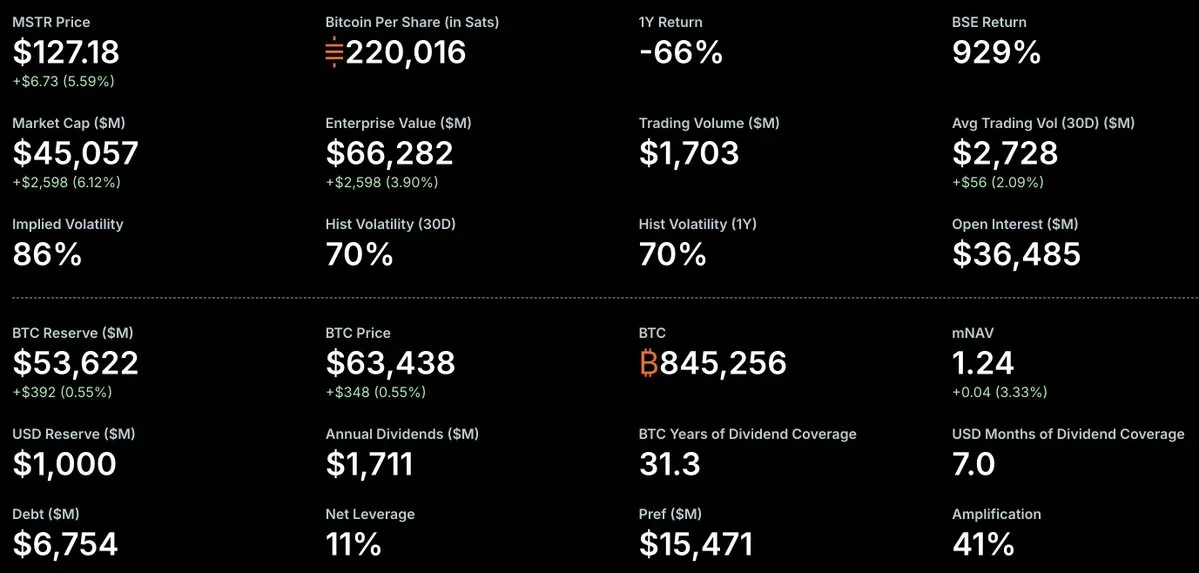
Strategy held 845,256 BTCs, or 4.02 per cent of the total supply of bitcoin, which had been accumulated through ongoing business funds。
Then I had to mention Strategy. Their model is the most extreme version of a buy-in by a body that defines the cycle. They turn the enterprise ' s financial management strategy into a bitcoin hoarding machine, raising funds through the issuance of shares and priority products and then directly investing in the purchase of bitcoin. As of June 2026, they held 843,706 bitcoins, or 4.02 per cent of total future supply。
In 2025 alone, they raised $25.3 billion through capital markets to purchase bitcoin. They don't sell, they don't hedge. They accumulate every week, regardless of price. This is a structural buyout that did not exist in previous cycles。
The key to understanding this institutional structure is how it affects the chain of data. When BlackRock buys bitcoin for its IBIT, these coins are transferred to Coinbase Prime for hosting, and they become almost invisible in chain analysis and cannot be tracked like a scattering activity. ETF purchases do not appear on the chain as a change of hand in tokens, as is the case with bulk transactions. The bitcoin accumulated by Strategy through the issuance of shares is reflected in the SEC documents rather than in the chain. As compared to any previous cycle, the demand for each dollar has led to less activity on the block chain。
This is the core technical reason why each top indicator fails. These indicators measure the activity on the block chain, the movement of tokens and the behaviour of realized profits - I don't know. The validity of these indicators presupposes that the bulk is the lead buyer. When the lead buyer operates through the chain of trustees and registered financial products, even if tens of billions of dollars flow into the asset, the indicators will show an extraordinary calm. The mathematical calculation of the indicators is not wrong, it is wrong to measure the wrong object。
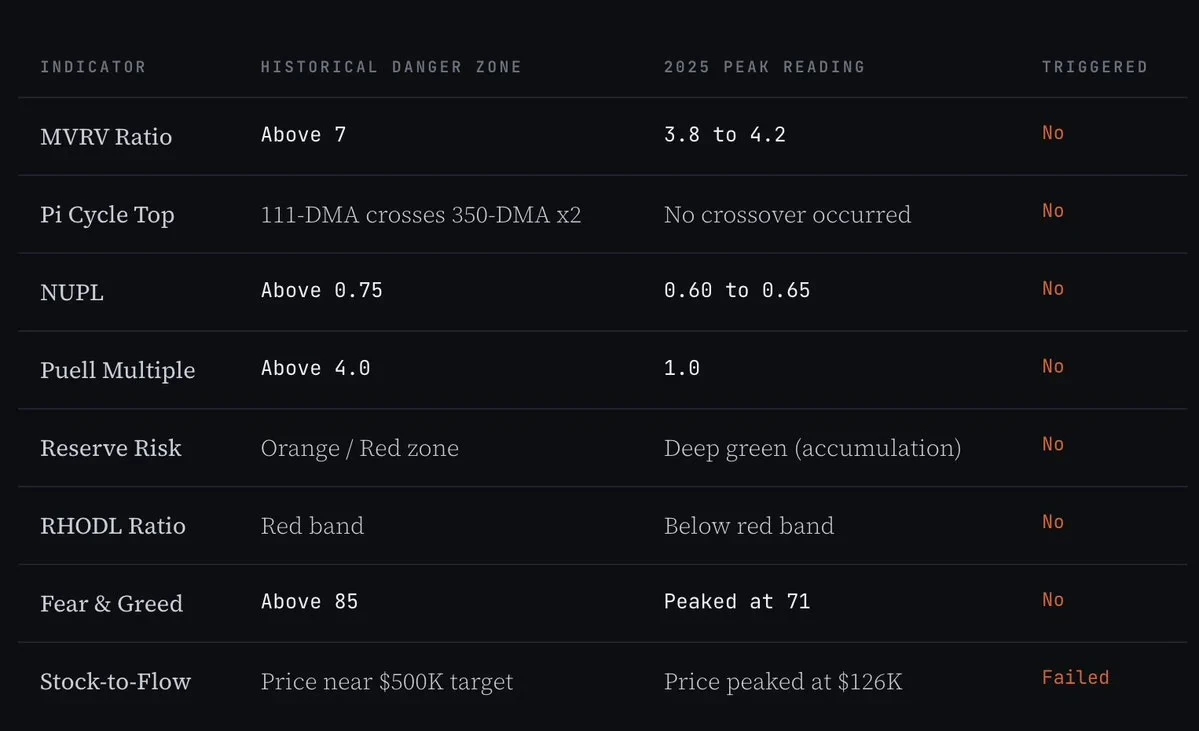
Why are all the top eight indicators not valid
These indicators used to have near-perfect records. In 2013, 2017 and 2021, they can send a peak signal only a few days or weeks from the actual top. The analysts were obsessed with staring at them throughout 2025, waiting for the signal to appear. Bitcoin broke $126,000 and started falling. However, all these indicators remain calmly neutral or cumulative。
This is not because the indicators are broken. It's because the market pattern they're designed to measure is no longer there. Finding out why each indicator is not working can give you a deeper understanding of the current market structure than looking at any price chart。
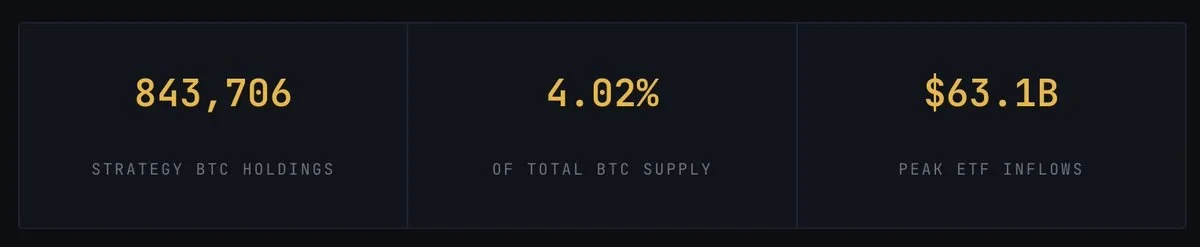
Bitcoin MVRV ratio: peaked at about 3.8 in 2025, with peaks ranging from 7 to 10 in previous cycles (data source: Coinglass)
THE MVRV RATIO IS DIVIDED BY THE MARKET VALUE OF BITCOIN (I. E. THE SUM OF THE PRICES OF ALL TOKENS THAT LAST MOVED ON THE CHAIN). WHEN THIS RATIO IS VERY HIGH, IT MEANS THAT ORDINARY HOLDERS ARE SITTING ABOVE VERY HIGH UNREALIZED PROFITS, WHICH, HISTORICALLY, OFTEN COINCIDES WITH SPECULATION. AT THE TOP OF 2013, THE RATIO EXCEEDED 10; IN 2017 IT WAS CLOSE TO 8; IN 2021 IT REACHED 7. THE ACCEPTED HAZARD THRESHOLD IS GREATER THAN 7。
At the peak of October 2025, MVRV reached only about 3.8 to 4.2. At a time when history is at a new height, that indicator is less than half the historical threshold. This is due to market structure: the accumulation of ETF buyers and Strategy companies reflected demand in bitcoin prices, but did not move the tokens in the chain-up required for MVRV calculations. Bitcoin, worth billions of dollars, is replacing institutional clients who lie in Coinbase Prime’s custody wallet and have never “moved” in the chain since they were purchased. The realized market value was reduced because the largest buyer in the cycle operated through an invisible chain-measurement trustee. Thus, when prices are at their peak, MVRV shows that the market is still in the middle of the cycle。
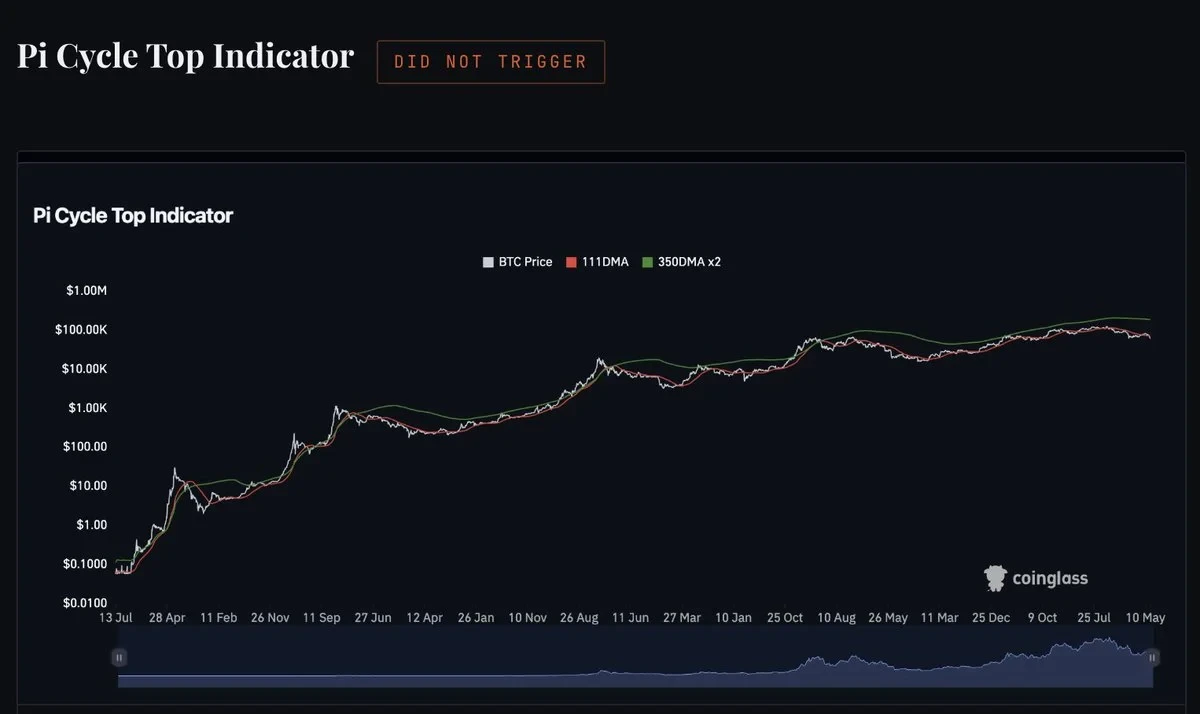
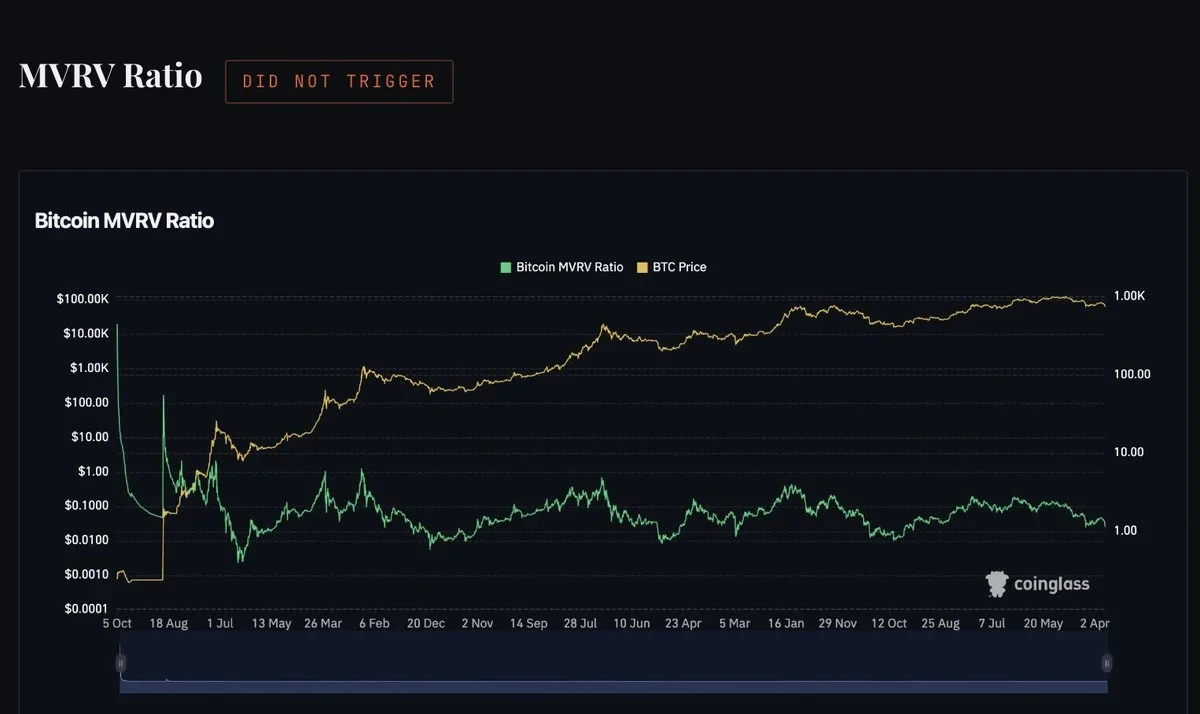
Pi Top indicator for the cycle: 111 days moving average line (DMA) has never worn twice the 350 days moving average line (350-DMAx2). At the top of the past, crossover often occurs within days of actual peak (data source: Coinglass)
The Pi cycle indicator is triggered when 111 days of moving average lines crosses up through twice the 350 days of moving average lines. It is one of the most accurate top signals in the history of bitcoin, which hit windows within days of actual peaks in 2013, 2017 and 2021. Many analysts predicted crossovers in September of 2025。
But that did not happen. The two lines continued to move in close proximity and spread again, without crossing. This is directly related to the logic of institutional demand: the Pi cycle intersects with the need for sharp and accelerated price increases, thus promoting long-term averages on the short-term average. This acceleration does not occur for institutional buyers operating according to the quarterly configuration schedule. They bring about a steady and lasting rise. In 20 months, from $40,000 to $126,000, the total increase may be as large as the bulk-driven parabolic surge, but it has a very different climb angle, as measured by the Pi cycle indicator. As the angle of reaching the top does not meet the trigger conditions, the indicator remains static even if it eventually reaches a record high。
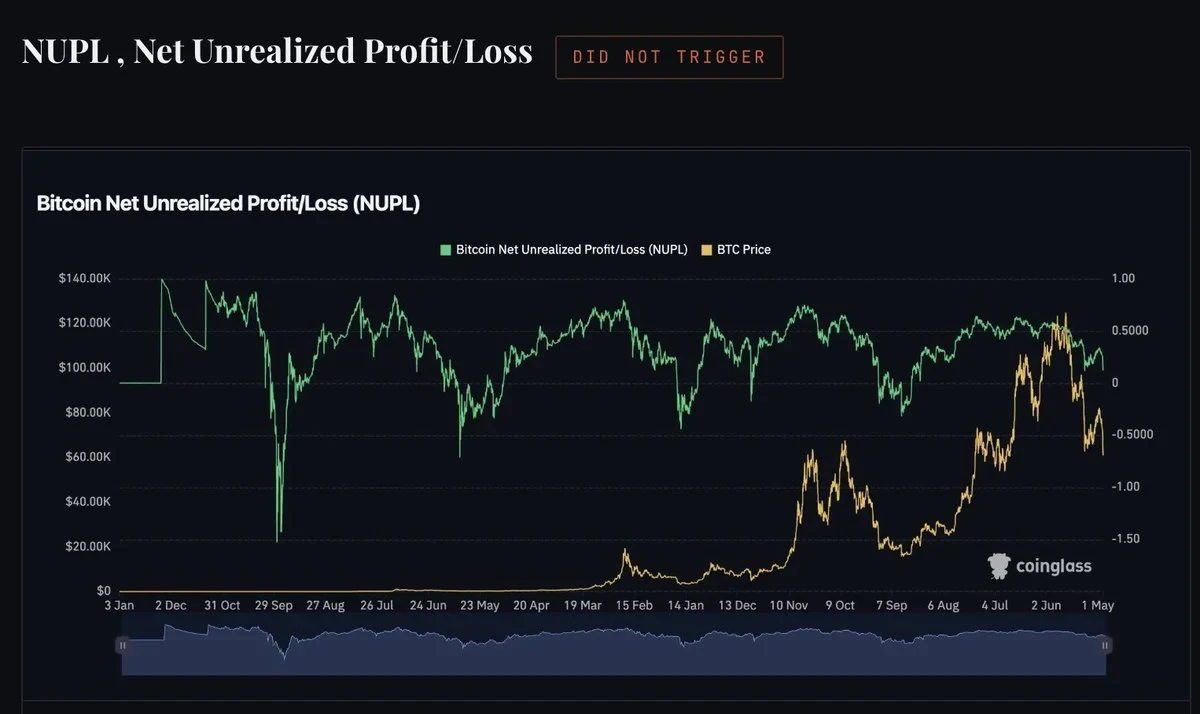
Bitcoin's NUPL: Never broke 0.75 at the top of 2025. Previous cycle peaks were well above this threshold (data source: Coinglass)
NUPL MEASURES THE RATIO OF UNREALIZED PROFITS TO UNREALIZED LOSSES THROUGHOUT THE BITCOIN NETWORK. WHEN THIS VALUE EXCEEDS 0.75, THE MARKET IS DIVIDED INTO FANATICISM. IN THIS STATE OF AFFAIRS, THE VAST MAJORITY OF THE HOLDERS HOLD LARGE PROFITS, WITH A HIGH PROBABILITY OF LARGE-SCALE SELLING. AT THE TOP OF THE PREVIOUS CYCLE, THE NUPL WAS DEEPLY TRAPPED IN A FANATICAL ZONE, IN SOME CASES CLOSE TO 1.0。
At the top of October 2025, the NUPL peak was only between 0.60 and 0.65. The indicator shows that the market is at a convinced stage, confident but not fanatical, and that the reading is accurate for the holders it can monitor. The long-term holders of bitcoin accumulated in 2022 and 2023 were very disciplined. They're not the kind of panic and profit that is needed to read the numbers. And the scattered participants who were supposed to push NUPL into the danger zone didn't buy bitcoin, they fired Memecoin. NUPL accurately describes the status of the holders of the chain it can measure, except that it cannot see the $63 billion lying in the ETF Trust。
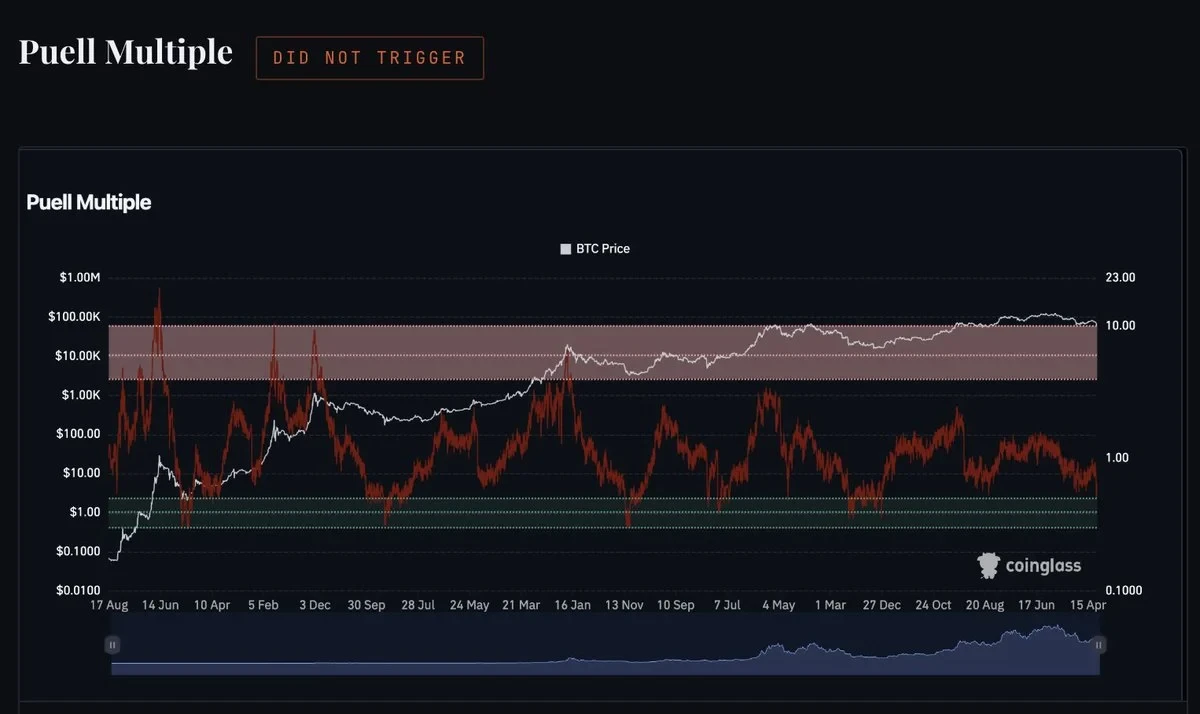
Puell Multiple: remained near 1.0 in the whole of the cow market in 2025. The highest point readings in history were 3.4, 6.6 and 10.48 (data source: Coinglass)
Puel Multiple compares the daily earnings of miners with their 365-day average. When miners earn far above their annual average (often because of soaring prices), they actively sell to lock up profits, thus creating supply pressures, which have often marked the peak of cycles in history. Previous top readings: 10.48, 2017 6.6,2021, 3.4. This trend itself has been declining in successive cycles。
In 2025, since the halving of block incentives in April 2024 reduced from 6.25 BTC to 3.125 BTC, miners ' income at each block level has been structurally lower than in the previous cycle. Although the price of bitcoin had doubled, the halving had reduced the amount of coins obtained by miners. So, Puell Multiple is hardly more than 1.0. In addition to the mathematical logic of halving, the nature of the modern mining industry has been quite different from that of 2013 or 2017. Large listed mining companies, which hedge risk and have institutional-level financial management systems, are no longer required to dump coins at peak prices, as early miners did. This indicator is tailored to the mining industry, which no longer exists in the same form, and is becoming less and less effective as each one is halved。
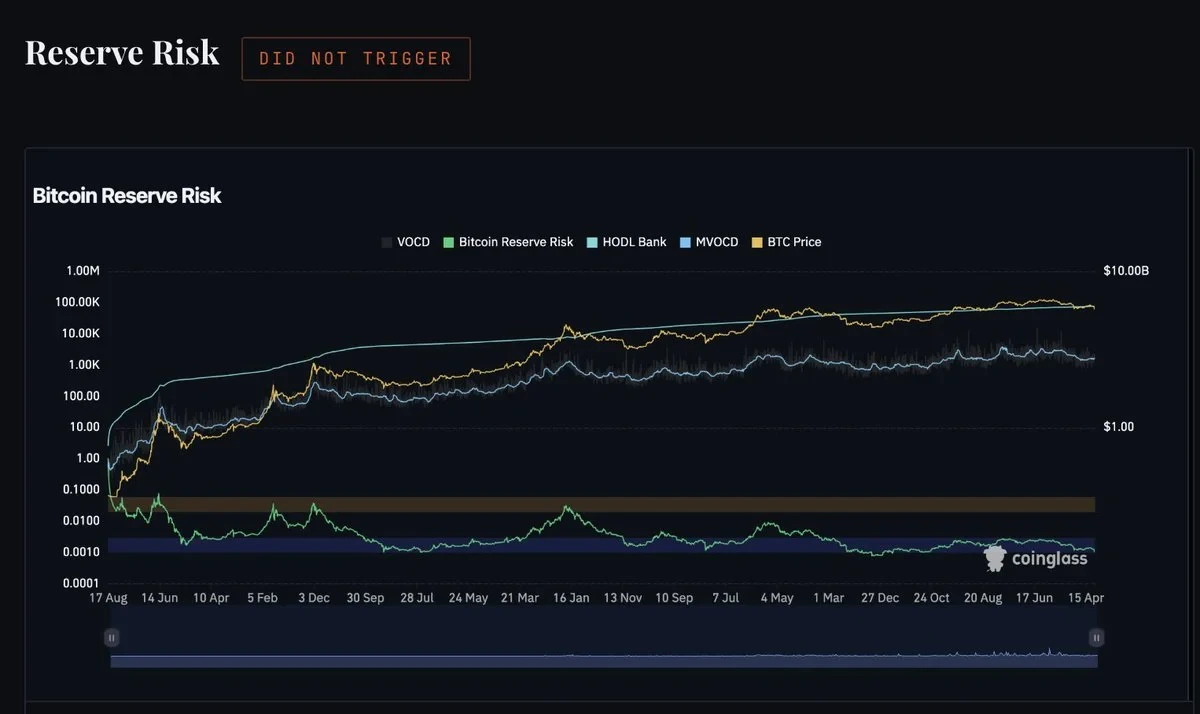
Bitcoin reserve risk: has been in deep accumulation throughout the cow market since 2025. Never approaching orange or red areas (data source: Coinglass)
RESERVE RISK MEASURES THE CONFIDENCE OF LONG-TERM HOLDERS OVER CURRENT PRICES. WHEN A LONG-TERM HOLDER DECIDES TO SELL AFTER A CERTAIN PERIOD OF TIME, THE OPPORTUNITY COST (I.E. HODL BANK) IS RELEASED. WHEN MANY LONG-TERM HOLDERS SELL AT THE SAME TIME AT HIGH PRICES, THE RISK OF RESERVES SURGES TO DANGEROUS AREAS. AT THE TOP OF THE PREVIOUS CYCLE, AS LONG-TERM HOLDERS EVENTUALLY SUCCUMBED TO PROFIT, THIS INDICATOR ENTERED ORANGE AND RED AREAS。
In 2025, the reserve risk remained deep in the accumulation zone throughout the cattle market. Long-term holders did not conduct large-scale sales sufficient to move the indicator. This is the most direct fingerprint of the institutional era: the largest holders, from the ETF Trust, Strategy, and the long-term diaspora that survived in Bear City in 2022, have been holding them firmly throughout the rise. They are not impulsive sellers, so they do not push reserve risk into the red zone. The indicators accurately measure their behaviour. It is only their behaviour that is extremely rational and self-disciplined in the price zones where, according to historical experience, large-scale sales should have been triggered。
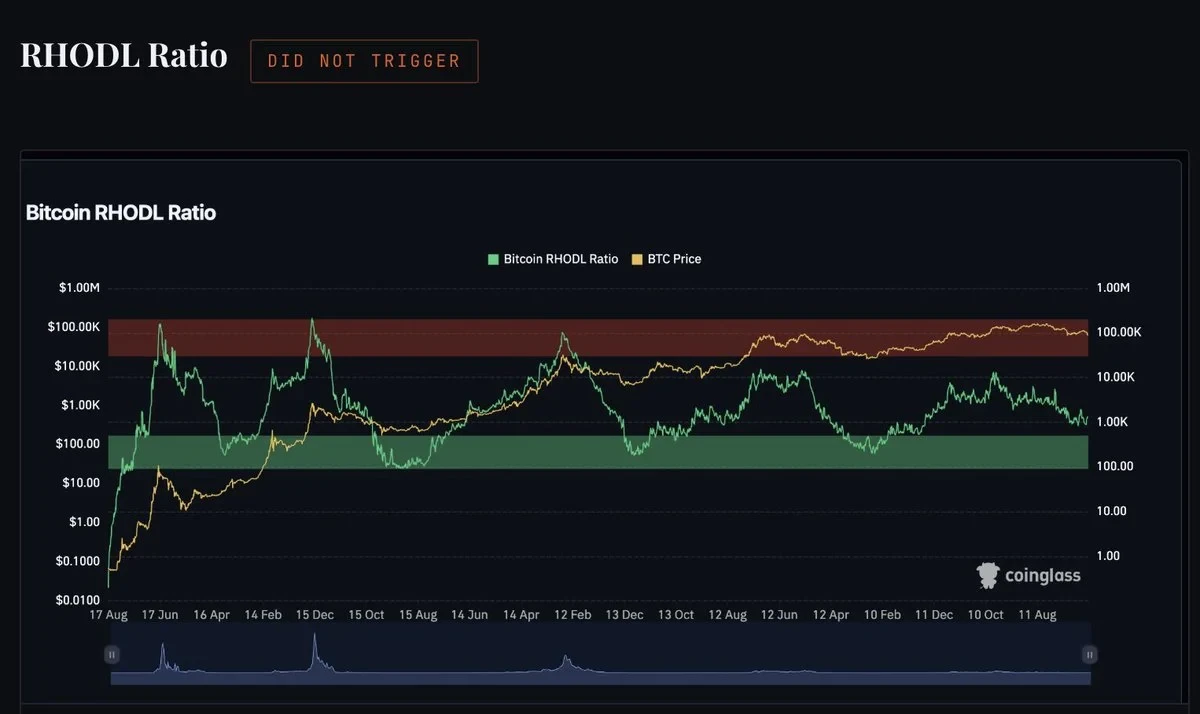
Bitcoin RHODL ratio: from low point up, but never enters the historical red belt usually associated with the top of the cycle (data source: Coinglass)
THE RHODL RATIO COMPARES THE REALIZED WEALTH OF THE CURRENCY THAT HAS BEEN MOVED IN THE PAST WEEK WITH THE UNMOVED CURRENCY FOR 1 TO 2 YEARS. HIGH RATES MEAN THAT THE MARKET IS DOMINATED BY FRESH CAPITAL, THAT IS, NEW BUYERS WHO HAVE JUST ENTERED HIGH PLACES. THIS IS TYPICAL OF THE VIOLENT TOP: POST-TEMPORAL DIASPORA FUNDS RUSH INTO THE TOP. AT THE TOP OF EACH PREVIOUS CYCLE, THE INDICATOR ENTERS THE RED ZONE WITH THE INFLUX OF NEW ENTRANTS INTO THE MARKET IN THE LAST FEW WEEKS。
In 2025, Rhodl recovered from the low point of Bear City, but never entered the red belt. It is not in bitcoin, but in Memecoin. RHODL measures the oscillation of FOMO sentiment to another completely different part of the encrypted market, where it disappears rather than on bitcoin. RHODL accurately describes the current situation: at the top, new bulk funds did not dominate the Bitcoin market. The indicator is simply not aware of this, as there is no equivalent tool to measure where the diaspora funds go。
Looking at the performance of the eight indicators at the top of a cycle, the conclusion is not that the indicators are malfunctioning. Rather, they correctly measure a market that no longer has the bulk-dominated structure that they apply. All of these tools were designed in an era when the price of bitcoin was almost entirely driven by diaspora speculation. They are calibrated to detect the frenzy of the diaspora. And in this cycle, it's not on bitcoin. These tools accurately report this fact. The only mistake is that, of course, the typical sprawl is considered the only way to peak the cycle。
In the end, the cycle ends. It is simply institutional, slow, no fireworks and no alarm。
Nothing but the cycle itself
Looking at all the indicators available in this cycle, we come to the honest conclusion that almost no indicators give a reliable top signal。
The chain of indicators group dumbfires: MVRV, Pi cycle, NUPL, Puell, reserve risk and RHODL were not able to reach hazardous areas at the highest point. The macro-indicators that many analysts value: the global M2 currency supply and the United States dollar index (DXY) have also broken down in a way that seems unreliable. Global M2 continues to rise after a bitcoin hit the top in October 2025, which means that this correlation is not working at the very moment it should be working. And the relevance of DXY? Although DXY recorded one of the worst annual performances in decades in 2025 (a decline of about 11 to 12 per cent), which should have been wind, rather than counterwind, bitcoin was closing in negative returns at the end of 2025. This correlation has lapsed in both directions。
So what's the trigger? The four-year cycle itself. If you're just drawing a circle in October 2025 on the calendar (a year after halving, consistent with peak time patterns in 2013, 2017 and 2021), you're right. This is not based on any complex analysis of chain data or macro-relevance, but only because the clock of the cycle rings on time。
That is the disturbing conclusion that this cycle forces us to face. None of the emotional indicators that we build to identify the top, which we see as reliable macro-relevance, and which we are obsessed with are triggered. The only thing that works is the simplest: the four-year half-year cycle that has remained unchanged for each cycle since 2012。
WHAT WILL THE NEXT CYCLE BRING? NO ONE CAN BE SURE. IN 2020, IT IS EXPECTED THAT INSTITUTIONAL BUY-IN OR HALVING WILL ITSELF DRIVE UP. BUT WHAT ACTUALLY HAPPENED WAS A GLOBAL PANDEMIC, HUNDREDS OF TRILLIONS OF DOLLARS IN PRINT, AND A WAVE OF UNFORESEEABLE, RISKY ASSET RAGING. SPECIFIC CATALYSTS THAT DRIVE THE 2028 TO 2029 CYCLE MAY BE ANYTHING: FOR EXAMPLE, THE BURSTING OF THE AI BUBBLE HAS ALLOWED LIQUIDITY TO FLOW BACK TO THE ENCRYPTED MARKET, THE NEW ENCRYPTION POLICY IN THE UNITED STATES HAS UNLOCKED INSTITUTIONAL CAPITAL, THE FED’S SHIFT DUE TO RECESSION, OR SOMETHING THAT HAS NOT BEEN THOUGHT OF. ATTEMPTS TO PREDICT SPECIFIC CAUSES MAY BE FUTILE. HISTORY HAS TAUGHT US THAT CYCLES WILL CONTINUE. IT'S JUST THAT ITS SPECIFIC MECHANISMS ARE UNEXPECTED TO ALL。
It's in Bear City at the middle of the day
Bitcoin is currently traded at between $62,000 and $63,000. This is about 50 percent lower than the new $126,296 in October 2025. The current market structure is consistent with the medium-term characteristics of the bear city and is not bottom-lined, but free to fall。
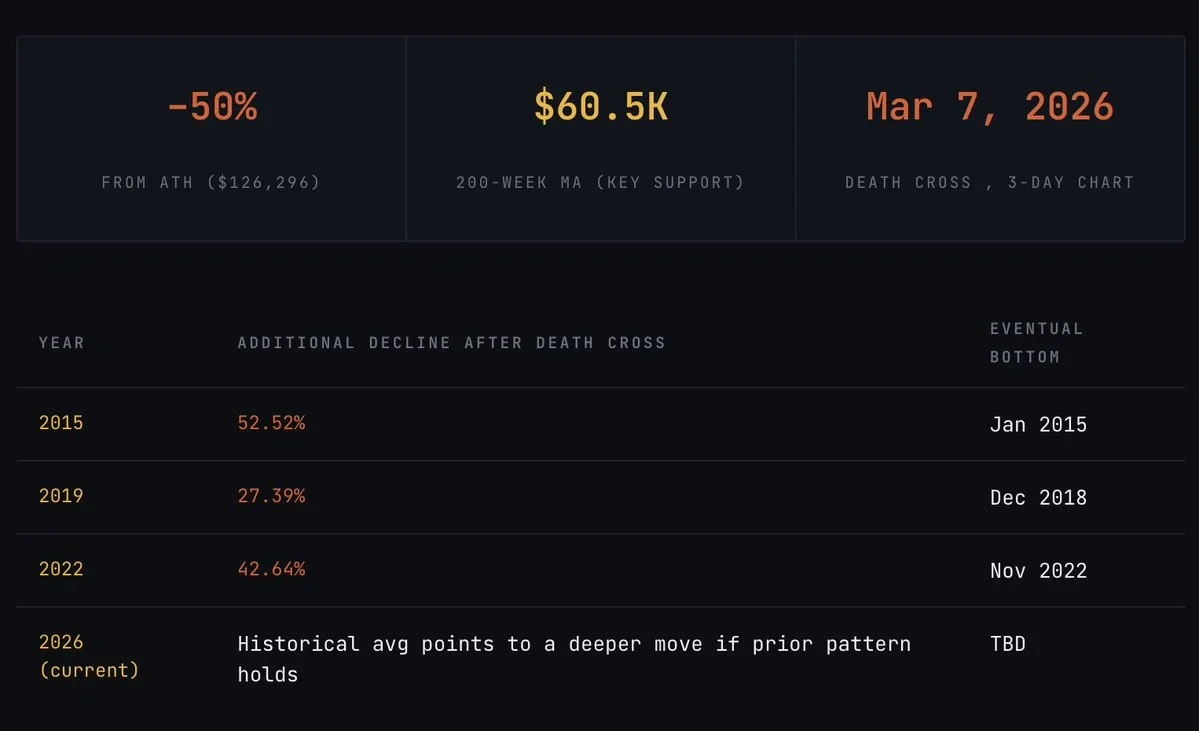
THE MOST IMPORTANT POSITION IN THE CURRENT STRUCTURE IS 200 WEEKS OF MOVING AVERAGE LINE (EMA 200) AND APPROXIMATELY $68,832 ON THE WEEKLY CHART. IN BEAR TOWNS, BITCOIN FOUND ITS SUPPORT AT OR NEAR THIS LEVEL. IN 2015 AND 2022, THE BEAR MARKET SAW BITCOIN SHATTERING NEAR 200 EMA ON THE WEEKLY LINE AND THEN BEGAN THE NEXT ROUND OF CATTLE. 200 WEEKS MA IS NOT A PRECISE BOTTOM SIGNAL, IT'S A ZONE. HISTORICALLY, BITCOIN HAD FALLEN SLIGHTLY BEFORE TURNING BACK AND TESTED MARKET RESOLVE BEFORE THE NEXT ACCUMULATION PHASE。
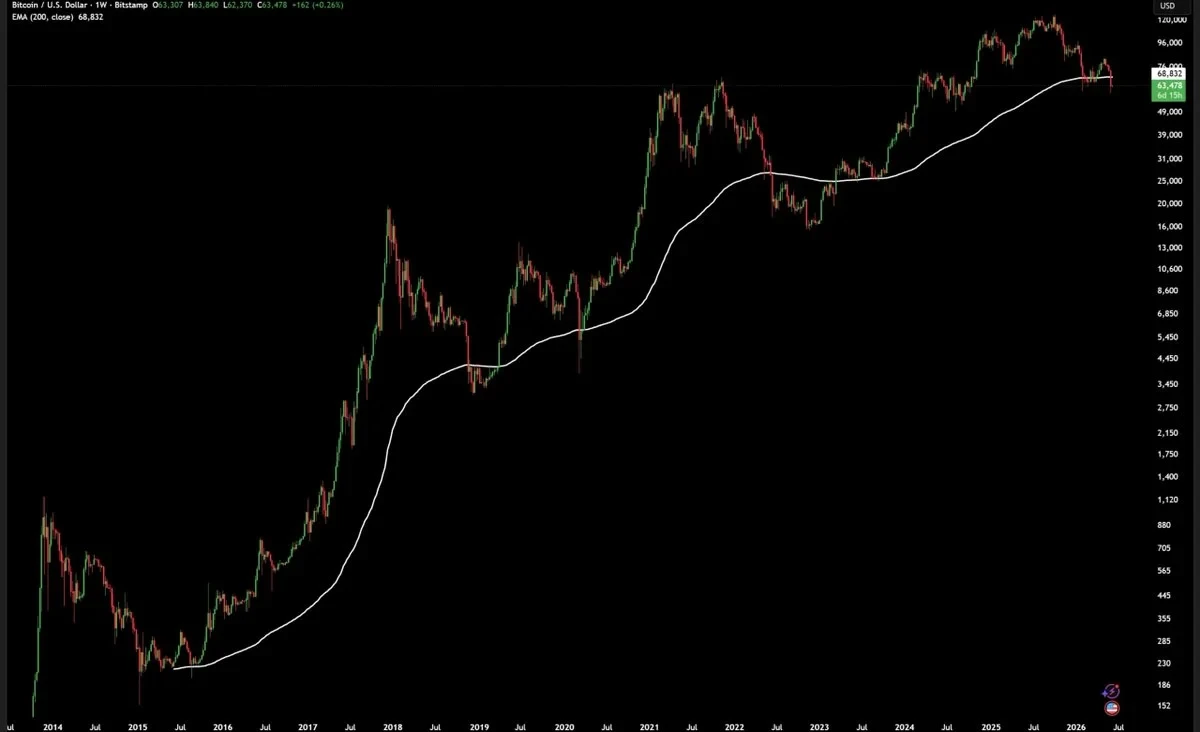
Bitcoin weekly map with 200 EMA: Every bear-market cycle finds support at or near this level before the next round of cattle is opened (data source: Bitstamp)。
On March 7, 2026, a dead fork was formed on a three-day chart of bitcoin. This is the same signal as before the Great Falls in 2014, 2018 and 2022. We'll look back at the drop of bitcoin after three days:
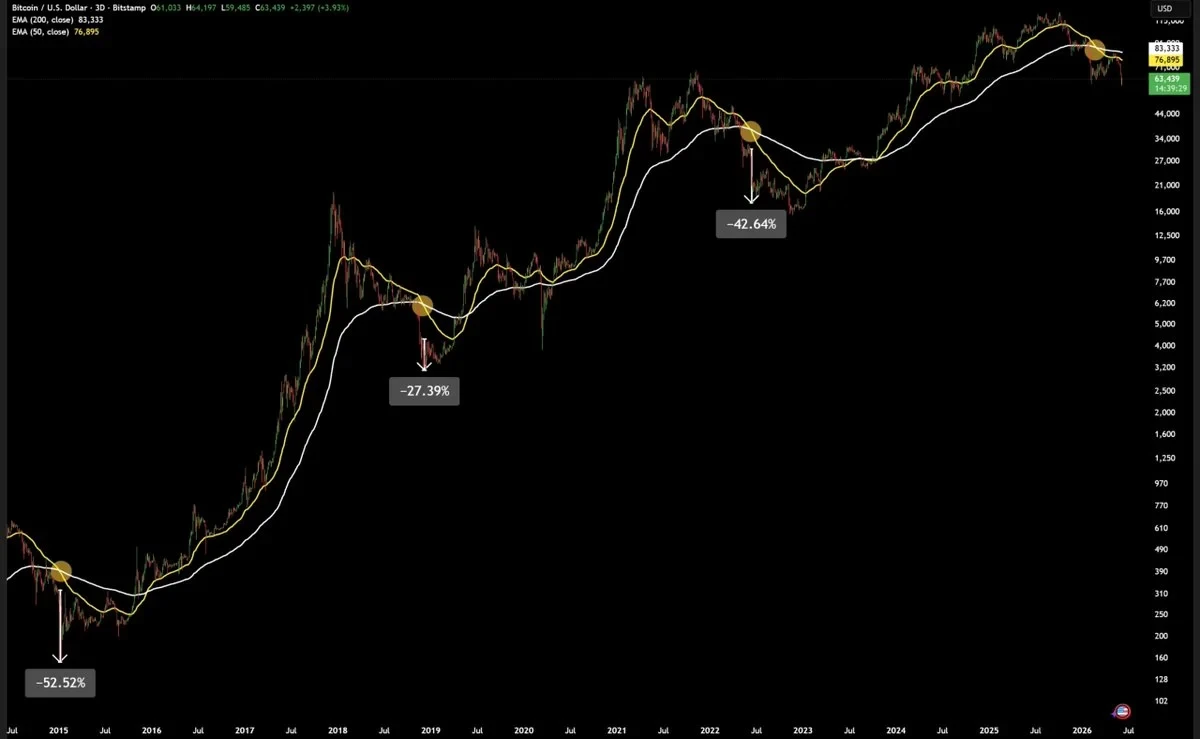
3-day chart of Bitcoin: On March 7, 2026, EMA 50 was wearing EMA 200. The dead fork led to a drop in distance points of 27, 43 and 53 per cent, respectively (data source: Bitstamp)。
THE PESSIMISTIC PREDICTION IS THAT IF 200 WEEKS OF MA FAIL TO HOLD AND APPLY THE AVERAGE DROP OF THE HISTORICAL FORK, THEN PRICES MAY POINT TO BETWEEN $33,000 AND $35,000. IT'S A NUMBER YOU NEED TO REMEMBER IN THE NEXT SITUATION。
The baseline scenario is that, taking into account the trend towards a gradual decline in the inter-cyclical decline and the existence of a bottom-up of a system that has not existed in Bear City in the past, the base may range from $45,000 to $55,000. At the point of time, the historical rhythm from the top to the bottom points to the third to the fourth quarters of 2026, especially from October to November 2026, that is, about a year from the top。
WHAT'S A CONFIRMED BOTTOM: BITCOIN HELD 200 WEEKS MA IN THREE CONSECUTIVE WEEKS OR MORE OF A WEEKLY WIRE CLOSING. ETF OUTFLOWS BEGAN TO STABILIZE AFTER SUSTAINED DIVESTMENTS. FEAR AND GREED INDEX RISES FROM 15 BELOW AND STAYS ABOVE 25 FOR AT LEAST TWO WEEKS. WHEN THESE CONDITIONS ARE COMMON AND NOT JUST A SINGLE PRICE LEVEL, THE ACCUMULATION PHASE HAS ALREADY BEGUN。
2026, bottom 2029
Once the current bear market phase is over, the periodicity framework will point to the following order:
THIRD TO FOURTH QUARTERS OF 2026: BITCOIN AT THE BOTTOM. TWO HUNDRED WEEKS OF MA AND ABOUT $54,000 OF REALIZED PRICES FORM THE SUPPORTING BELT. HISTORICALLY, THIS IS THE BEST ACCUMULATION AREA IN ANY CYCLE — A PERIOD OF EXTREME PESSIMISM BEFORE THE NEXT ROUND OF EXPANSION BEGINS. THIS IS ALSO THE PERIOD DURING WHICH MOST OF THE BULK INVESTORS WHO ENTERED CLOSE TO THE TOP ABANDONED AND SOLD THE COINS AT A DISCOUNT TO LONG-TERM HOLDERS。
2026 to 2027: cumulative phase. The price movement has been wide open, boring and violent. There is no major headlines and no momentum. This phase feels like nothing happened, which is why most people miss it. Each of the previous cycles had a completely identical phase between the bottom of bear and the opening of the next round of cattle。
APRIL 2028: NEXT HALVE. THE BLOCK INCENTIVE FELL FROM 3.125 BTC TO 1 5625 BTC. THE PRESSURE ON MINERS TO SELL WAS AGAIN HALVED. INSTITUTIONAL DEMAND FROM THE ETF COMPLEX (NOW MUCH LARGER THAN TODAY) BEGAN TO ABSORB SUPPLY SHOCKS. BITCOIN STARTS TO BUILD UP ENERGY。
2028-2029: Expansion after halving. If the four-year cycle remains valid, this is the next major cattle market. Based on consistent time patterns, peaks in 2029 are most likely to occur in the third or fourth quarter of the year。
One important point is that the 2025 cycle shows that the violent spiral that pushed the peak of the previous cycle may no longer occur in the same way. With the growing share of bitcoin in institutions and the increasing share of bulk participation in total demand, the arrival of the top may still not be accompanied by extreme indicator readings, no parabolic price movements, and no clear cyclical signals that can be easily identified in the past with subsequent light. You need to rely on tools that are different from those that worked in 2021 for the next top。
Conclusions
Bitcoin's four-year cycle hasn't been broken. At the top, at the right point of the halving cycle, prices exceeded the previous highs and reached historic highs. The cycle operates in full compliance with expectations。
What doesn't work is the tools people use to identify the top. Every classic chain of indicators is dumb, because every classic chain of indicators measures the behaviour of a family that is not in bitcoin. Before the bulk capital reached Bitcoin, they were systematically sucked through Memecoin, celebrity coins and high FDV VC token structures. By October of 2025, the bulk fuel that drives the violence to the top and triggers fanaticism had been depleted。
Agencies that have replaced the diaspora: ETF, Strategy, professional asset configurors, created a wave of increases ranging from low points in 2024 to peaks of 215 per cent, but they operate without parabolic K lines and without triggering any alarm. The indicators show that everything is calm, but the market continues to peak。
The only thing that really works is the periodicity of the cycle itself. In October 2025, it was about 535 days before it was halved in April 2024, and approximately one year after the end of the cycle implied by the pattern, almost fully in line with historical time patterns. Not because of complex indicator analysis, but because the same four-year structure, which has remained unchanged since 2012, has again been validated。
BITCOIN IS CURRENTLY IN THE BEAR MARKET PHASE, WHICH IS CONSISTENT WITH THE PEAK OF ALL PREVIOUS CYCLES. 200 WEEK EMA IS THE STRUCTURAL REFERENCE LEVEL THAT SUPPORTS ALL PAST BEAR BOTTOMS. THE NEXT TREND WILL FOLLOW THE PERIODICITY SCHEDULE. SPECIFIC CATALYSTS, SPECIFIC CHARACTERISTICS OF BEHAVIOUR, AND WHETHER OLD INDICATORS WILL EVENTUALLY BE TRIGGERED — THESE ARE UNPREDICTABLE. TIME PATTERNS, THE ONLY SIGNAL THAT NEVER FAILS。
