
The American stock is in the largest bubble in history? Four valuation indicators with red lights on
The market has reached the intersection of "no valuation" and "no profit." 。
Original by Claude, Deepwater TechFlow
Introduction:THE CAPE RATIO OF THE STANDARD 500 REACHED 39, THE HIGHEST LEVEL SINCE THE INTERNET BUBBLE IN 2000; THE BUFFET TARGET REACHED AN ALL-TIME HIGH OF 230 PER CENT; AND THE TOP 10 COMPONENTS ACCOUNTED FOR 35 PER CENT OF THE INDEX WEIGHT, WITH THE HIGHEST CONCENTRATION IN THE MODERN MARKET. MULTIPLE VALUATION INDICATORS ALSO SEND OVERHEATING SIGNALS, BUT WALL STREET'S JUDGEMENT IS DEEPLY DIVIDED: ONE SIDE CONSIDERS AI PROFIT GROWTH TO SUPPORT THE PREMIUM, AND THE OTHER CONSIDERS THIS TO BE THE CLASSIC FEATURE OF THE TOP OF THE BUBBLE。
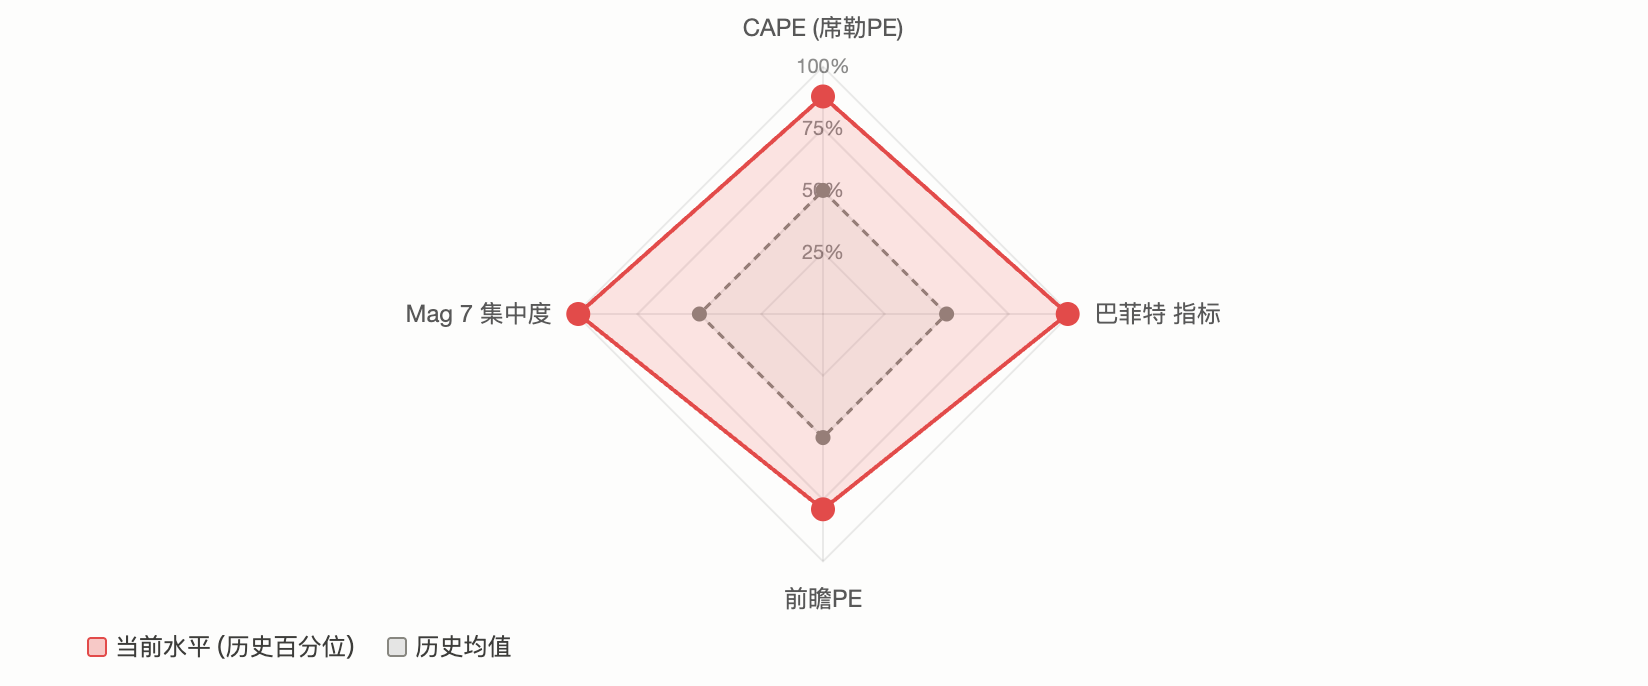
Standard 500 is in a rare state: almost all mainstream valuation indicators are red-lighted simultaneously。
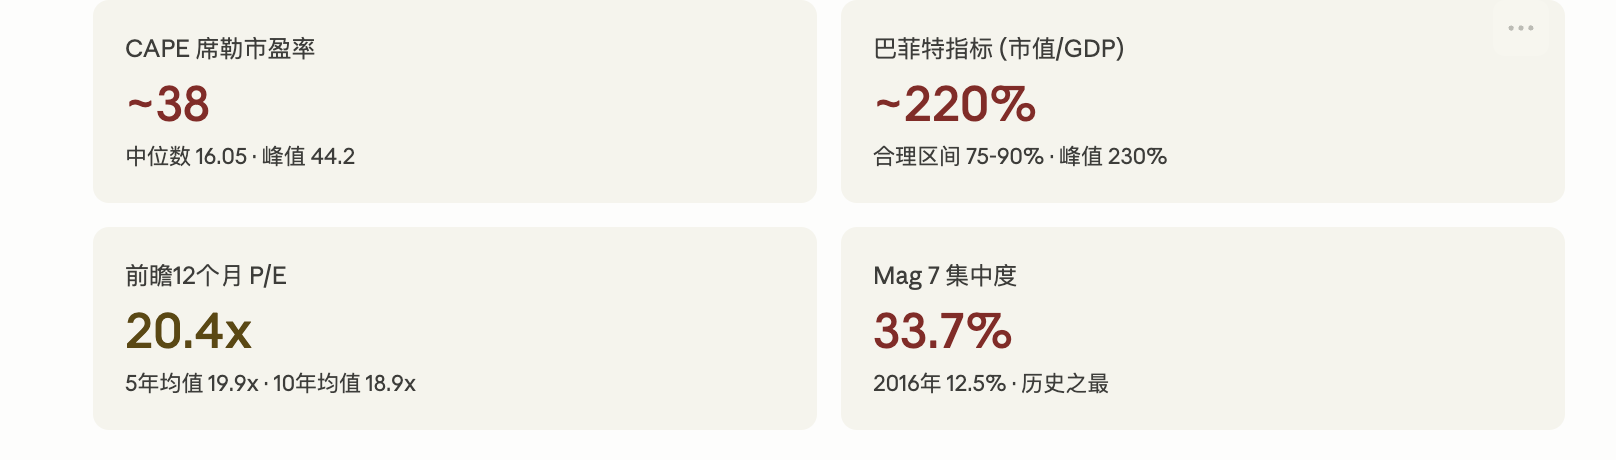
CAPE (the Shiller surplus) is approaching 40, the highest level since the Internet bubble; the Buffet indicator (market value/GDP ratio) has broken 230 per cent, updating historical records; the top 10 constituents have over 35 per cent of index weights, and market concentration is in areas unprecedented in modern financial history. A post on the Reddit community r/stocks characterizing the current market as "the most excessive expansion in history" triggered more than 2100 comments and 640 comments, focusing on a central issue:
IS THIS THE SIGNAL AT THE TOP OF BULLSTOWN, OR IS IT THE BEGINNING OF AI DRIVING THE "NEW PARADIGM"
CAPE RATIO REACHED 39, AFTER THE PEAK OF THE INTERNET BUBBLE IN 2000
The Schiller surplus (CAPE) is a valuation indicator developed by the Nobel laureate Robert Sheller, which uses the inflation-adjusted average profit of the past 10 years to calculate the earnings to eliminate disruptions in the short-term economic cycle。
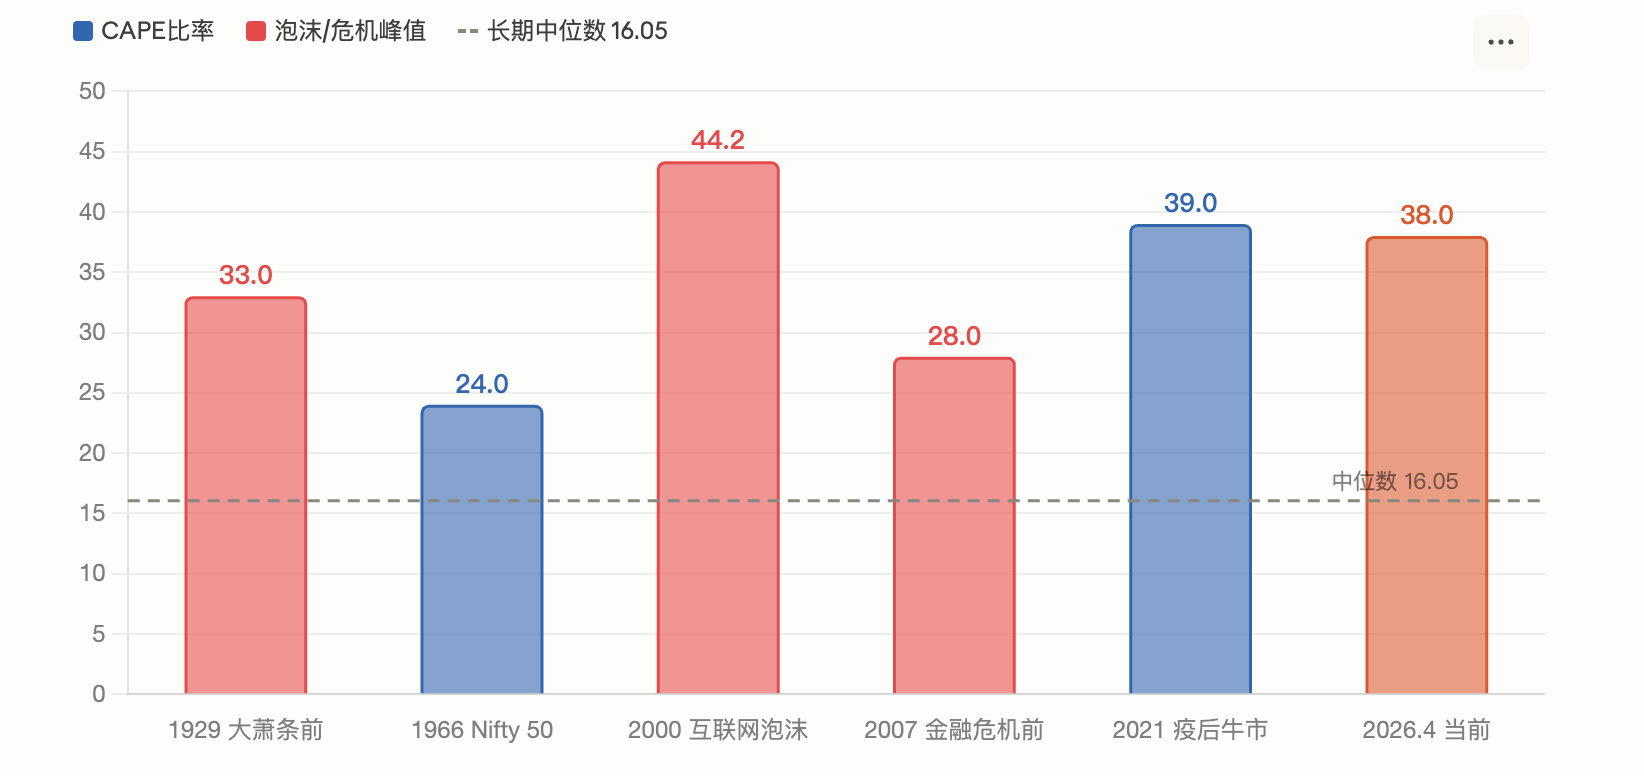
According to Motley Fool in March, the CAPE ratio of 500 reached 39.2 in February. According to GuruFocus as of 1 April, the indicator is 38.66. Both readings were the second highest in history, after the peak of the Internet bubble in 2000, when 44.2, with a long-term median of 16.05。
Historically, CAPE has been at a similar height twice: in the late 1920s (and then in the Great Depression) and in 2000 (in the wake of the break-up of the Internet bubble, the logo 500 fell by 49 per cent in two and a half years). According to the Sheller study model, the current CAPE level corresponds to a future annualized return of only about 2 per cent。
Motley Fool's analysis indicates that Hiller himself expressed concern that CAPE had exceeded that level for only three periods since 1881, around 1929, 1999 and 2007。
However, the IndexBox report also acknowledges that high CAPE does not automatically mean that the crash is imminent, as the market rose by more than 40 per cent after breaking 30 at the end of 2023。
The Buffet Target is breaking, 230%, the highest record in half a century
BUFFET ONCE CALLED THE MARKET VALUE/GDP RATIO "THE BEST SINGLE MEASURE OF VALUATION" IN A 2001 EDITION OF FORTUNE MAGAZINE. HE SUGGESTED AT THE TIME THAT 75-90 PER CENT WAS REASONABLE AND MORE THAN 120 PER CENT MEANT THAT THE MARKET WAS OVERESTIMATED。
According to Advisor Perspectives, by the beginning of 2026, the indicator had once reached 23.3 per cent, the highest level ever recorded, and was defined as a "serious overestimation" of approximately 2.09 standard deviations above the trend line. The most recent reading in March fell back to 227.5 per cent, still the second highest in history. On the basis of this ratio, GuruFocus extrapolates that the annualized return on equity in the next 8 years is about -0.3 per cent。
According to GuruFocus on 14 April, the rate was 219.5 per cent. Critics have pointed out that the indicator does not adequately take into account two structural changes: a significant increase in the profitability of United States enterprises compared to historical centres, and an increase in revenues from large United States companies coming from abroad (higher market value but not reflected in domestic GDP). However, supporters believe that, even after the trend has been addressed, the current readings are still in historical extremes。
Market concentration is the highest in modern history, Mag 7 over 30%
Valuation is only one dimension of the problem. The structural risks of markets are equally disturbing。
According to AhaSignals, on 13 April, the top 10 components of the scale represented an index weight of 35.59 per cent, the top five accounted for 25.97 per cent and the Magnificent 7 for 30.44 per cent. The comprehensive concentration risk index (ACRI) readings produced by the Agency are 81/100 at a critical level. According to Motley Fool in April, the weight of Mag 7 in the standard 500 increased from 12.5 per cent in 2016 to 33.7 per cent at present。
The December 2025 report of the CNBC cites the warning of Nick Ryder, Chief Investment Officer of Katmmere Capital: Investors are still over-focused in Mag 7, and he recommends a full decentralization outside the United States of America ' s large-plough growth stock. During the same period, Yardeni Research Managing Director Ed Yardeni suggested that investors do not match Mag 7 and “additional 493” (Impressive 493)。
The real risk of concentration is that when a few equity-dominated indices move, their decline will disproportionately slow down the overall market. This was initially validated in the first quarter of 2026. According to 24/7 Wall St, Microsoft, Amazon and Ingweida fell by about 20 per cent, 9 per cent and 6 per cent respectively during the year, slowing the market value-weighted scale 500 down by nearly 4 per cent, while the equivalent weight-weighted scale 500 (RSP) was slightly positive during the same period。
"History repeats" or "this is different."
In the face of these data, Wall Street's judgement is sharply divided。
Look at the empty pieThe central argument is the return of the valuation average. The co-founder of GMO, Jeremy Grantham, clearly characterized the current market as an AI-driven, large bubble in his latest research. He noted that current AI ' s real income from investments was much less than capital expenditure, and OpenAI predicted that its own operating losses would amount to $17 billion in 2026 and would increase to $35 billion in 2027. According to the GMO, the classic signal at the top of the foam (speculative stock collapse, high-quality stock run-offs) has not yet appeared fully, but it simply means that the foam has not yet peaked, not that it does not exist。
IO Fund ' s periodic analysis is also cautious. According to the Agency's report, 2026 was at the intersection of the Gann 60 and 4-year presidential cycles, while each stock in Mag 7 was peaked between July 2025 and February 2026, with the index reaching the last high core unit having fallen silently, a “classical warning signal of the end of the cow market”。
Look at the pieIt is important to focus on the fundamentals of profit. According to FactSet data for April, the 12-month market gain rate for the app 500 is 20.4 times higher than the 10-year average of 18.9 times, but has fallen 22 times higher than at the end of 2025. If this expectation is met, high valuations can be absorbed to some extent。
Fidelity’s global macro-research director Jurrien Timmer’s judgment is relatively modest: since the conflict in Iran, the top 500 has retreated by less than 10%, a decline that has occurred on average every other year in history. Profits are expected to grow at an annualized rate of 17 per cent and have not yet been substantially affected by geopolitical headlines。
Morgan Stanley's investment management team also pointed out in its 2026 outlook that most cattle markets last between 5 and 7 years and that their fourth year has recorded positive returns. The Bank ' s non-United States equity allocation has risen to an all-time high。
BlackRock, for its part, stated that the increase in the technology unit in 2025 was driven mainly by profit-making growth rather than by the expansion of valuation, and that the current valuation was justified on the basis of growth expectations。
superimposed geo-intensity impact: Iran ' s war and stagnating risk
Beyond the valuation controversy, the macro environment adds additional uncertainty。
The Iranian conflict pushed oil prices through $100 per barrel, and the Standard 500 crashed 200 days of moving average in March. According to FinancialContent, the March meeting of the Federal Reserve maintained the "hawk-in-arms" and the updated interest-point map only anticipated a further reduction for the remainder of 2026. In a report dated 17 March, UBS characterized recent fluctuations as "a necessary replacement for high valuations" rather than the beginning of the bear market, maintaining the target price of 7700 points at year-end。
Goldman Sachs has increased the probability of recession for the next 12 months to about 30 percent. This resonates with the warning of the valuation indicator: if the economic downturn coincides with high valuations, the historical average of peak valleys has dropped by 32 per cent. However, if profits continue to grow (the FactSet consensus is expected to be 17 per cent), a significant return has tended to be limited in history and to recover faster。
FOR INVESTORS, THE TENSION AT THE SIGNAL LEVEL IS CLEAR. LONG-TERM VALUATION INDICATORS ARE ALMOST FULLY RED, BUT SHORT- AND MEDIUM-TERM PROFIT DATA REMAIN STRONG. THE MARKET HAS REACHED THE INTERSECTION OF "NO VALUATION" AND "NO PROFIT." THE OUTCOME WILL DEPEND ON WHETHER AI CAPITAL EXPENDITURE TRANSLATES INTO SUSTAINED PROFITS AND WHETHER GEO-SHOCKS ULTIMATELY TRANSMIT RECESSION。
