
Bitcoin$60,000-$70,000 in saw-sawing: weak volatility and time to build the base
The chain data show that the accumulation of supplies and the surrender of long-term holders continue, with an upward pressure of $80,000 to $126 million constituting the greatest resistance. 。

Photo by Glassnode
Original: AididiaoJP, Foresight News
Bitcoin is still in the range of $60,000 to $70,000. The spot market showed signs of early absorption and the derivatives market was replaced. Volatility cooled and the holding structure balanced. However, the market lacks the confidence needed to achieve a sustained breakthrough in the absence of a clear catalyst。
Summary
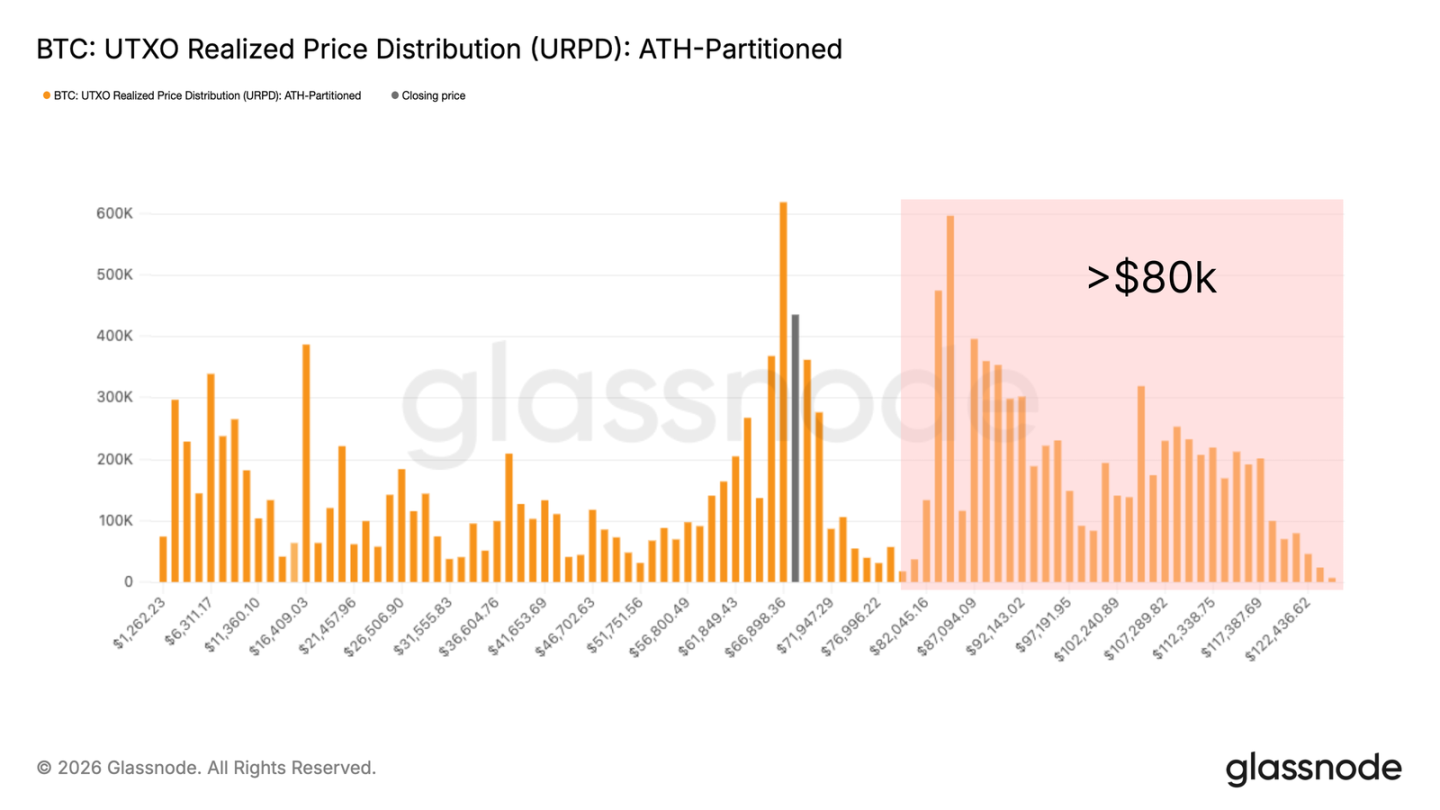
- BITCOIN STILL STAYS BETWEEN $60,000 AND $70,000. THE URPD DATA SHOW THAT THERE IS AN INTENSIVE SUPPLY BUILD-UP BETWEEN $80,000 AND $126,000. IN ORDER TO ABSORB THIS BUILD-UP OF SUPPLY, A GREATER PRICE CONCESSION OR A LONGER REDISTRIBUTION PROCESS MAY BE REQUIRED。
- THE TOTAL SUPPLY IN DEFICIT WAS CLOSE TO 8.4 MILLION BTCS, SIMILAR TO THE MARKET STRUCTURE OF THE SECOND QUARTER OF 2022. AT THAT TIME, THE MARKET NEEDED TO REDISTRIBUTE ABOUT 3 MILLION BTCS TO RETURN TO THE MIDDLE OF THE CYCLE。
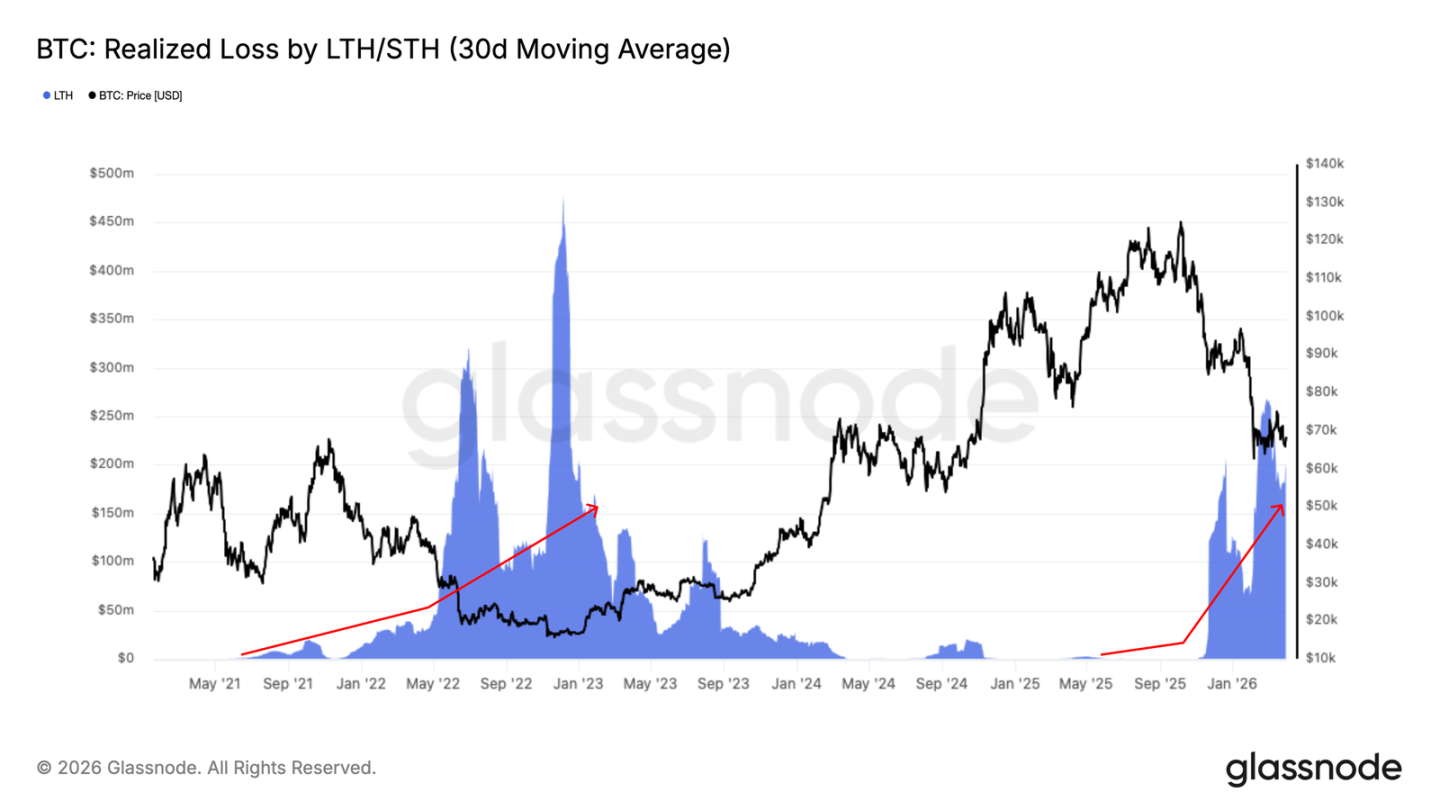
- The realized losses for long-term holders have continued to climb since November 2025 and now reach a level of approximately $200 million per day, confirming the emergence of voluntary surrenders. This indicator, if cooled below $25 million per day, would be a key threshold for market bottoming。
- Coinbase ' s cumulative trade-off margin has been converted to a slight positive, indicating that the spot buyer is beginning to absorb seller pressure. However, the current level of demand is still far below what the market normally sees when it is formed at a persistent low point。
- Treasury flows have become more concentrated: Marathon has distributed about 15,000 BTCs, while Strategy is still the only institution that continues to buy on a large scale。
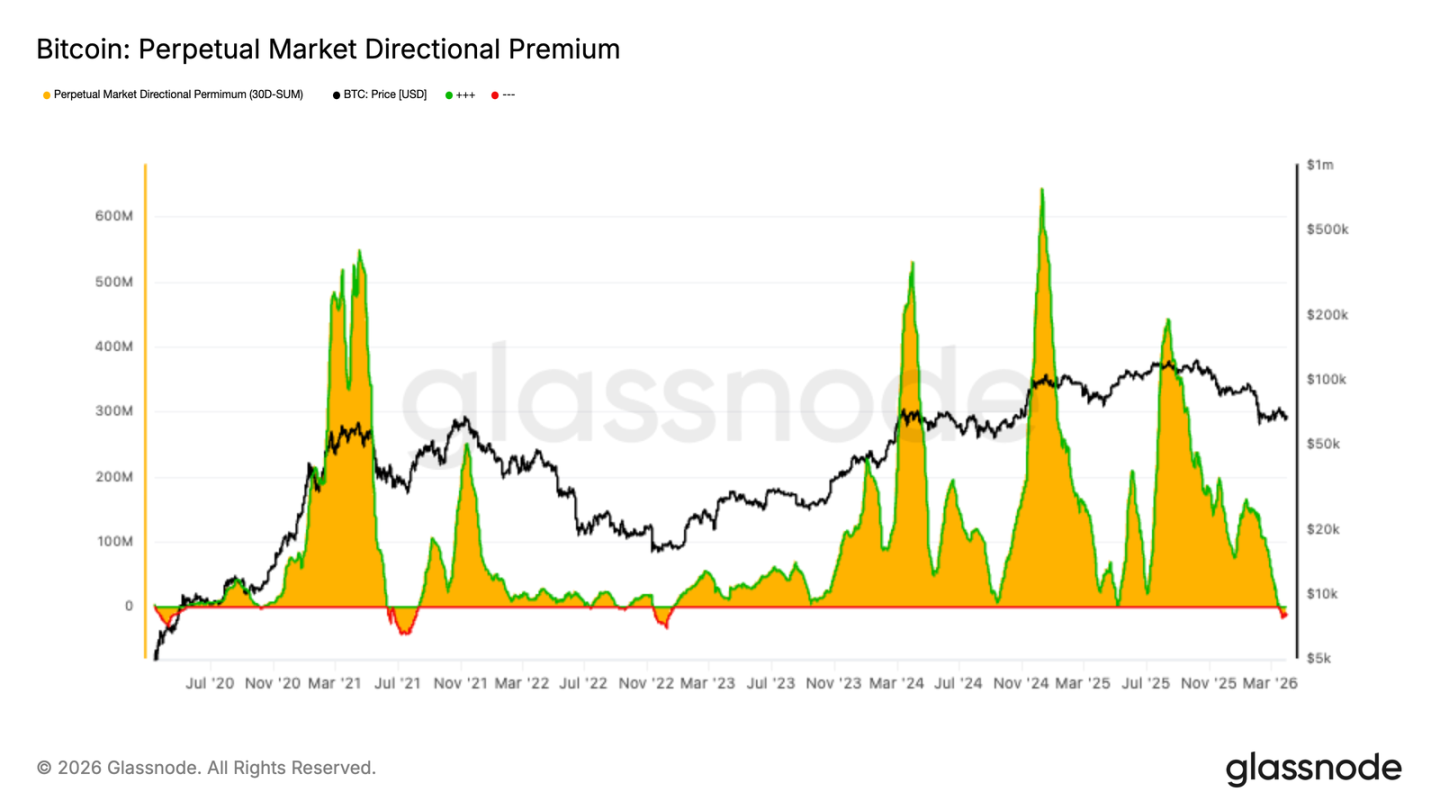
- The directional premium on the market for a lasting contract has been condensed to a neutral level and is slightly below zero, reflecting the replacement of over-leveraging and the decline in speculative enthusiasm。
- The current hold-up of the contract for perpetuity is far from being driven by momentum, with multiple openings flat and empty interests re-emerging. This makes futures markets more balanced as a whole, but also more cautious。
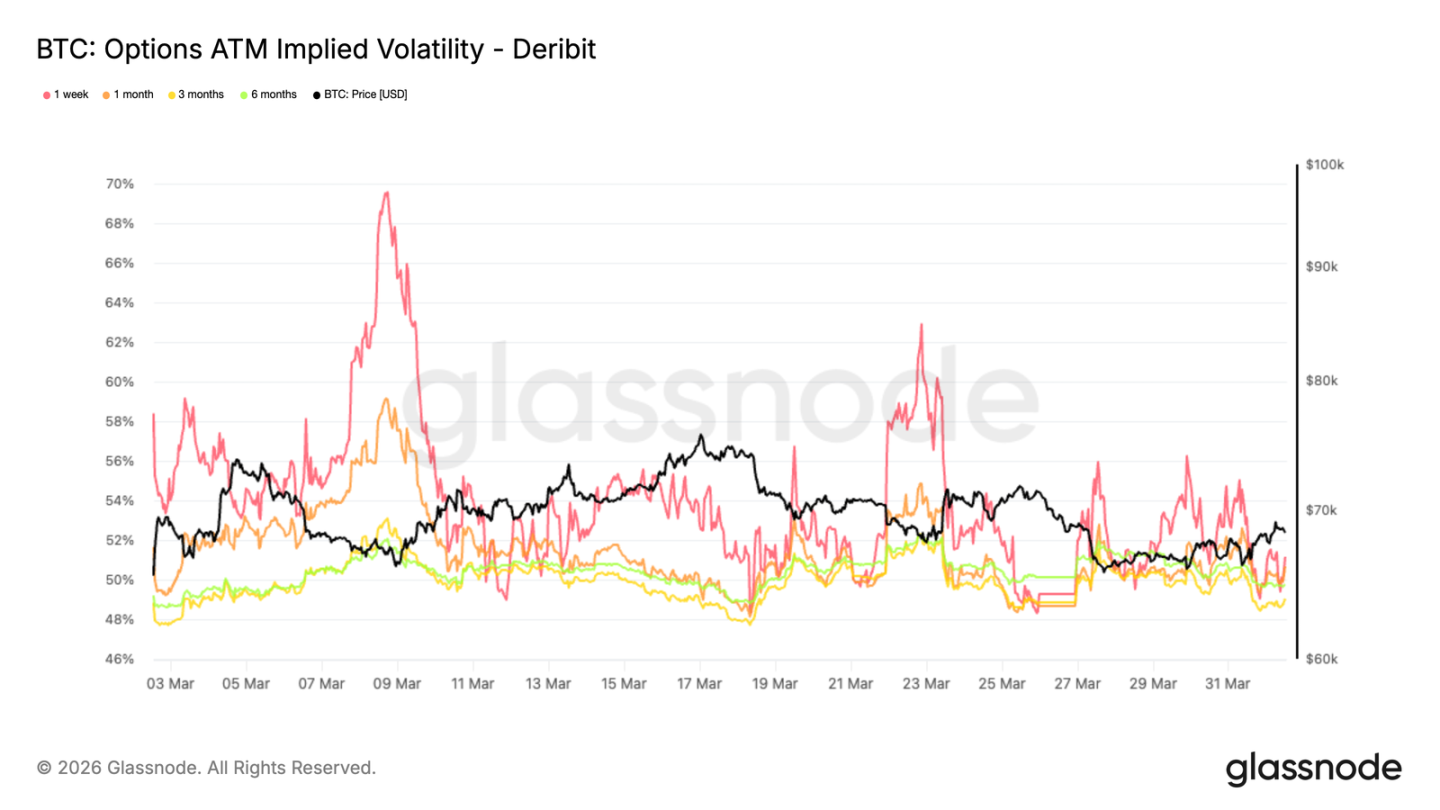
- The persistent weakening of the implied volatility throughout the duration structure indicates that the options market is pricing a more calm environment in the short term and a reduced demand for volatility exposure。
- The bias indicator began to shift downwards, indicating a return to protective layout, but still at levels well below those normally associated with stronger hedge demand。
- The Gamma position has been transformed into a market-supporting state, reducing the causative effect of falling prices and indicating that short-term warehouse layouts for market traders have stabilized after the recent negative gamma phase。
Insight on the chain
Volume of unrealized supply
As prices vary from $60,000 to $70,000, the present report will emerge from short-term price dynamics and assess the structural forces that shape the current market environment. As noted in recent reports, one of the most persistent resistance to the suppression of kinetic energy comes from a large supply of over $80,000, which is currently in an unrealized deficit。
The group, which has endured a bear city environment for more than six months, faces a dual choice of behaviour: selling in any rebound to reduce further losses; and psychological surrender as prices deepen。
THIS IS CLEARLY ILLUSTRATED IN THE URPD CHART, WHICH SHOWS THAT THERE IS AN INTENSIVE SUPPLY CLUSTER IN THE RANGE OF $80,000 TO $126,000, WHICH IS HELD FIRMLY ABOVE MARKET PRICES. IT IS LIKELY THAT THIS BUILD-UP OF SUPPLIES WILL NEED TO BE ADDRESSED BY ATTRACTING NEW BUYERS THROUGH SIGNIFICANT PRICE CONCESSIONS, OR BY GOING THROUGH A LONGER PERIOD OF TIME TO MOVE THESE CURRENCIES AWAY FROM THE HOLDERS WHO ACHIEVE LOSSES TO THE MORE DETERMINED NEW HOLDERS。
Supply at loss
IN ORDER TO QUANTIFY THE TOP SUPPLY PILES, WE CAN USE THE INDICATOR "TOTAL SUPPLY IN DEFICIT". IT COUNTED THE AMOUNT OF BITCOIN IN CIRCULATION AT THE LAST MOVING PRICE ABOVE THE CURRENT SPOT PRICE. AFTER 30 DAYS OF SIMPLE MOVING AVERAGE SMOOTH PROCESSING TO REMOVE SHORT-TERM NOISE, THE INDICATOR NOW STANDS AT ABOUT 8.4 MILLION BTCS, MEANING THAT BETWEEN 8 MILLION AND 9 MILLION YUAN HAVE REMAINED IN DEFICIT FOR THE PAST MONTH。
THE MAGNITUDE OF THIS VALUE, COMBINED WITH THE FACT THAT SPOT PRICES ARE CLOSE TO THE MIDDLE-LINE LEVEL OF THE CURRENT CYCLE, MEANS THAT MARKET STRUCTURES ARE SIMILAR TO THOSE OBSERVED IN THE SECOND QUARTER OF 2022. HISTORICALLY, ADDRESSING THE BUILD-UP OF SUPPLIES ON SUCH A SCALE REQUIRES THE REDISTRIBUTION OF LARGE AMOUNTS OF MONEY FROM DEFICIT HOLDERS TO NEW BUYERS ENTERING AT LOWER PRICES. THE 2022 BEAR CITY PRECEDENT IS INSTRUCTIVE. THE TOTAL SUPPLY, WHICH IS USUALLY IN A STATE OF LOSS, HAS BEEN REDUCED FROM MORE THAN 8 MILLION BTCS TO ABOUT 5 MILLION BTCS BEFORE THE MARKET IS DECISIVELY BACK ON THE MIDDLE LINE OF THE CYCLE. THIS MEANS THAT BEFORE MARKET CONDITIONS NORMALIZED, ABOUT 3 MILLION COINS HAD BEEN EXCHANGED。

Tracking ongoing redistribution
The next step was to monitor the pace of the process, following the determination of the size of the deficit supply to be redistributed. The indicator “long-term holders have realized losses” measures the total losses achieved by investors who have held them for more than six months and are now sold on a lower base than their initial costs. This indicator directly captures the process of active redistribution of supplies at the top of the table above。
The 30-day moving average has been rising steadily since November 2025 and is now at a high level of approximately $200 million per day. This confirms that long-term holders are increasingly surrendering to the current market. While this loss realization is a necessary and constructive step in the process of clearing the bear market, it alone is not sufficient to constitute an adequate condition for market reversal. This indicator, if significantly cooled to below $25 million per day, would represent a more convincing signal of seller ' s power failure and a historical prerequisite for market building before sustainable cattle markets start。
Underlink Insight
Coinbase
The spot market shows initial signs of stability. The 30-day moving mean line of the Coinbase drop-off margin has changed to a weak positive in the latest data. Previously, negative values had been experienced for a longer period of time in January and early February, when continued seller pressure reflected continued distribution。
Recent shifts indicate that buyers are beginning to absorb and support available supplies as prices stabilize. However, the size of the positive margin remains moderate, indicating that current demand remains exploratory rather than driven by strong conviction。
Historically, a stronger market recovery has required the continuation of positive spot flows, while short-term buying behaviour has often been difficult to follow. The recent recovery is now constructive, but a more sustained recovery may require a sustained increase in buyer pressure。

Financial flows are becoming more complex
In recent months, the broad base of financial flows has weakened significantly. The latest data show a more uneven and selective pattern of activities. In the early stages of the cycle, corporate currency hoarding was supported by a broader configuration. However, recent financial flows indicate that buyout support is becoming increasingly concentrated。
Most notably, Marathon has sold about 15,000 BTCs, one of the clearest examples of the recent decline in the corporate capital pool rather than the increase in exposure. In contrast, Strategy appears to be the only continuing structural buyer; even if the involvement of other companies becomes more sporadic, it continues to buy regularly。
This shift points to significant changes in market structures. Business demand is no longer a trend towards widespread business hoarding, now appears narrower and more dependent on a single dominant player. The end result is that business buyouts, while still present, are less broadly based and therefore less reliable as a source of structural support than in the early stages of the cycle。

Resumable premium reset
The directional premium for the sustainable contract market continues to shrink, with 30 days combined currently approaching neutral levels and slightly below zero. This marked a marked slowdown in the market from the multidimensional conditions that had underpinned the increase。
This shift suggests that the speculative silos are being levelled and empty interests are beginning to re-emerge. The current structure does not reflect strong market beliefs, but rather a more prudent and balanced market pattern for sustainable contracts。
Historically, the replacement of direction premiums has often been accompanied by consolidation or trend failure. This is because the leverage has been re-pricing after a longer period. In this sense, the recent fall in premiums suggests that speculative will has receded, leading to a total replacement of the eternal market with less leverage。
Volatility is expected to decrease
After the replacement of the options market has been completed, the implied volatility is the first place to show change. Bitcoin ' s duration structure moved down as a whole from last week, with the front end falling. 1 The implied fluctuation rate for the cycle is currently 51 per cent and the monthly rate is 49 per cent. The implied volatility of other durations is closely organized, with a monthly period of 49.8 per cent, which points to a significantly compressed duration structure。
This reflects a market that is being reduced to expectations of large recent fluctuations, although uncertainty remains in the macro context. The relatively stronger support for longer-term fluctuations suggests that uncertainty does not disappear, but is pushed to more distant temporal dimensions. In the short term, pricing is shifting to a more robust volatility system, as markets lack immediate catalysts and demand for options flexibility has receded。
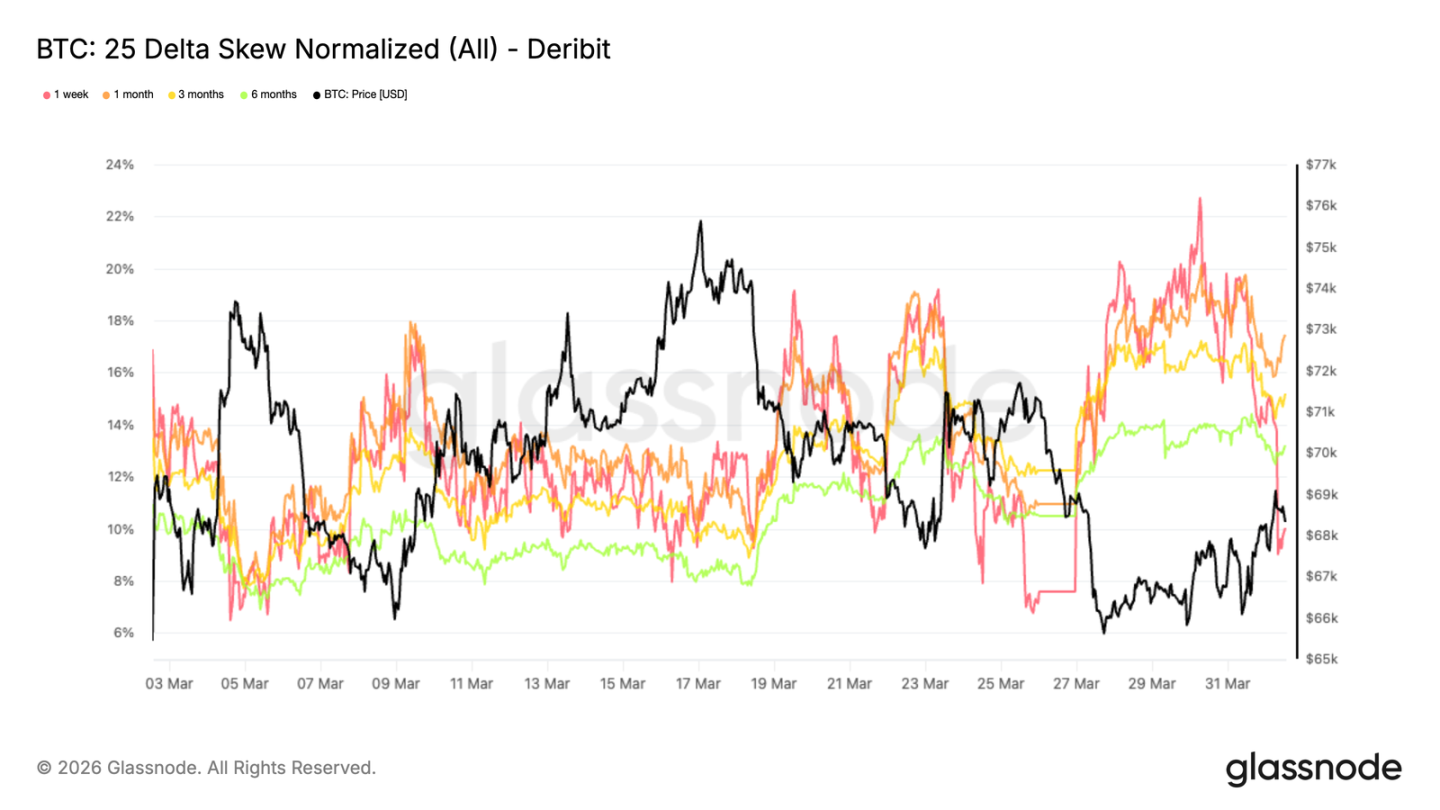
Next-line protection starts rebuilding
as fluctuations are expected to weaken, the bias indicator reveals a more cautious shift in the holding structure. the higher the 25 delta bias (calculated by the drop option minus the increase option), the greater the market pricing preference for lower protection. last week, cyclical bias hit 22.7 per cent of the monthly peak before retreat, reflecting its sensitivity to immediate price trends. in contrast, the longer-term bias continued to rise and remained high: 17.4 per cent for the monthly period and 13.2 per cent for the monthly period。
This division between different durations is illustrative. Although recent price stability has slightly eased short-term hedge demand, there is still a strong buyout of protective options in the medium to long term. The market does not make radical pricing of large fluctuations, but the entire duration structure has always given more weight to downside risk. This points to a sustained defensive bias, not just a temporary response to short-term market fluctuations。
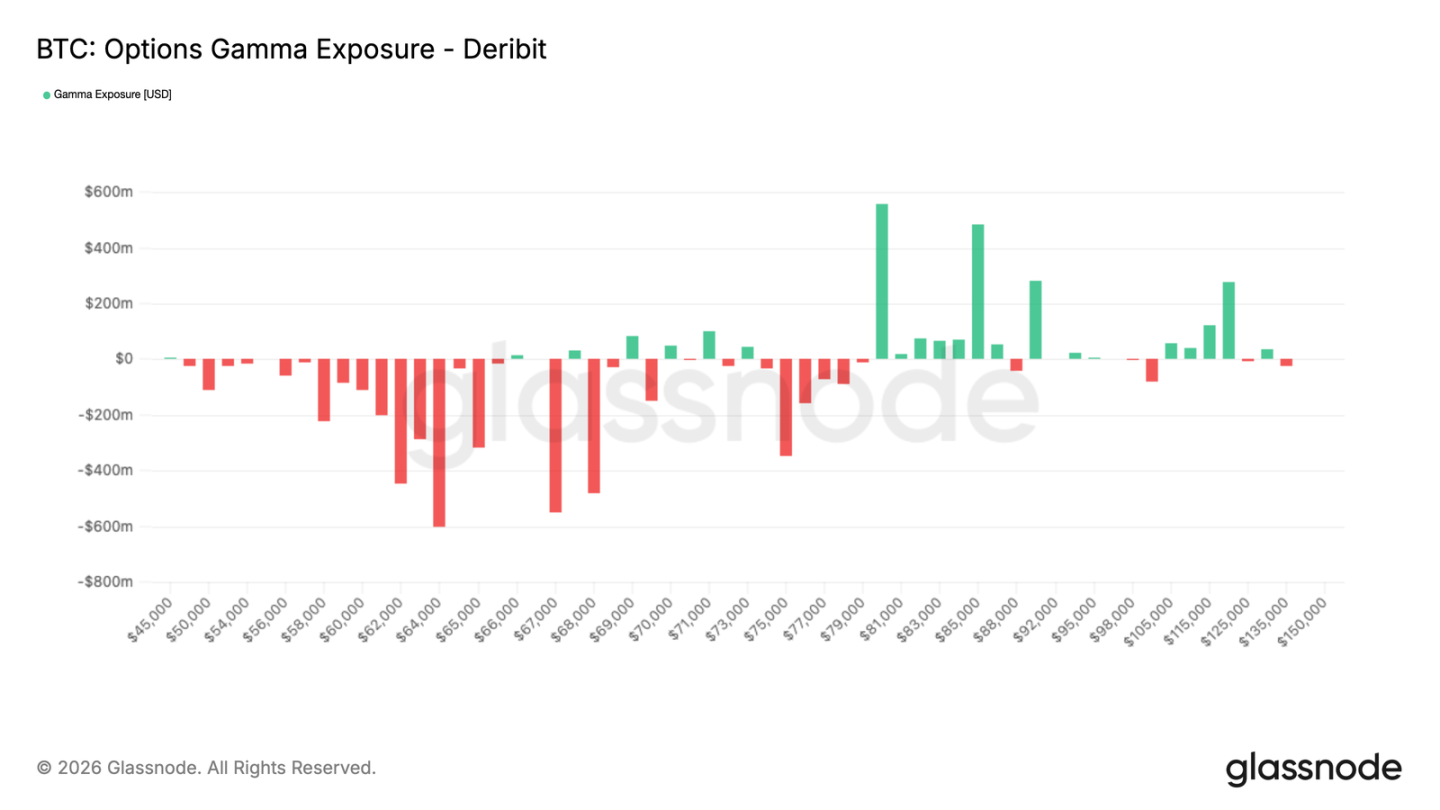
Short term Gamma below market level
This more defensive silo structure becomes more relevant when it corresponds to the gamma opening for market traders. Negative Gamma is currently accumulating below current price levels, from $68,000 to more than $50,000. This means that the market is buying down options at the current price and does not expect the recent rebound to last long enough, forcing market traders to become counterparties to these transactions。
Under this mechanism, marketers will have to sell when prices are weak, thereby magnifying downward volatility. The overall market structure is fragile because market liquidity remains thin after the expiration of the 27 March contract. Once prices enter the region, downward momentum may be exacerbated by push-off pushes, which will trigger accelerated sales sales, transform possible incremental changes into more drastic re-pricing, and possibly retest the level of $60,000 - the low point at which they were sold on 5 February。
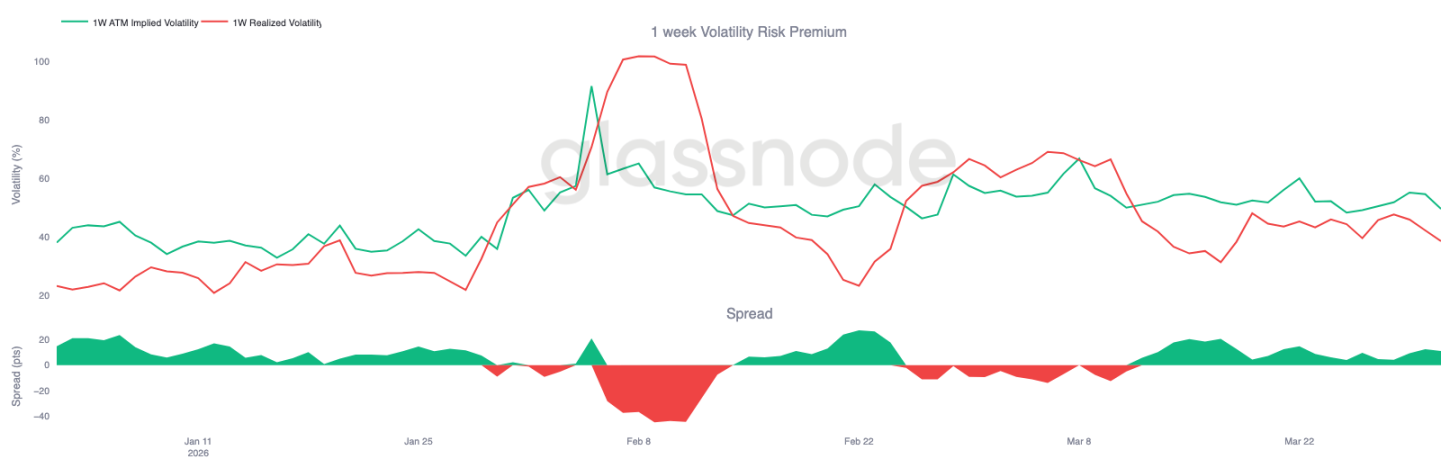
A quiet rate of volatility obscures vulnerability
The current situation is further destabilized by the fact that the implied rate of volatility is consistently higher than the realized rate. At the front end of the period, the rate of fluctuations was 38 per cent for one week and 49 per cent for one week, with a difference of 11 percentage points. This gap has continued for more than three weeks, indicating that the pricing of options is consistently higher than the actual level of market volatility。
At first glance, this reflects a seemingly stable market, as the realization of volatility remains manageable. However, continued premiums indicate that despite a lack of real price direction, market participants continue to price risks, pointing to an environment of low market confidence。
When the volatility rate is higher than the rate achieved and the gamma rate is negative, price changes may be magnified by relatively small sales pressure. This is because markets are rapidly adjusted from a compressed pricing base with limited capacity to absorb capital flows。
Conclusions
Bitcoin is still locked in a broad band of $60,000 to $70,000. The market showed initial signs of stability, but it did not yet have sufficient kinetic energy to make a decisive breakthrough in either direction. The chain still reflects the fact that the market is in the process of being rehabilitated: the supply in a deficit situation is at a high level and the surrender of long-term holders has not yet completely cooled. At the same time, there are signs of improvement in spot demand, indicating that the seller no longer has full control of the market。
Under-chain markets, the situation is equally balanced. There has been a significant contraction in the financial needs of the enterprise, with the replacement of the long-term contractual leverage, the softening of implied volatility and increased stability in the holding of the market. Together, these signals point to an environment that is no longer under obvious pressure but still needs to find stronger market beliefs。
At present, it appears that Bitcoin is going through a phase of redistribution rather than a clear trend. Inter-temporal shocks are expected to remain the dominant feature of the market until there is a more significant expansion of spot demand and the top-heavy supply buildup begins to be cleared。
