By Michael Nadeau
Compiled: White-language block chains
the post-epidemic era has been defined by fiscal dominance as — — an economy driven by government deficits and short-term bond issues, and liquidity remains high even if the fed maintains high interest rates。
Today, we are entering a private sector-led phase, and the Ministry of Finance is recovering liquidity through tariff and expenditure restrictions, compared to the previous Government。
That's why interest rates need to decline。
we have analysed the current cycle through the lens of global liquidity to highlight why the current round “ the devaluation transaction ” has reached its final stage。
Is fiscal dominance over
we always want everyone to be & & & & & & ; & & & & & & & ; & & & & quo; & & & & quo; & & & & & quo; & & & & quo。
that is why all the recent discussions about &ldquao; the devaluation trade &rdquao; have drawn our attention。
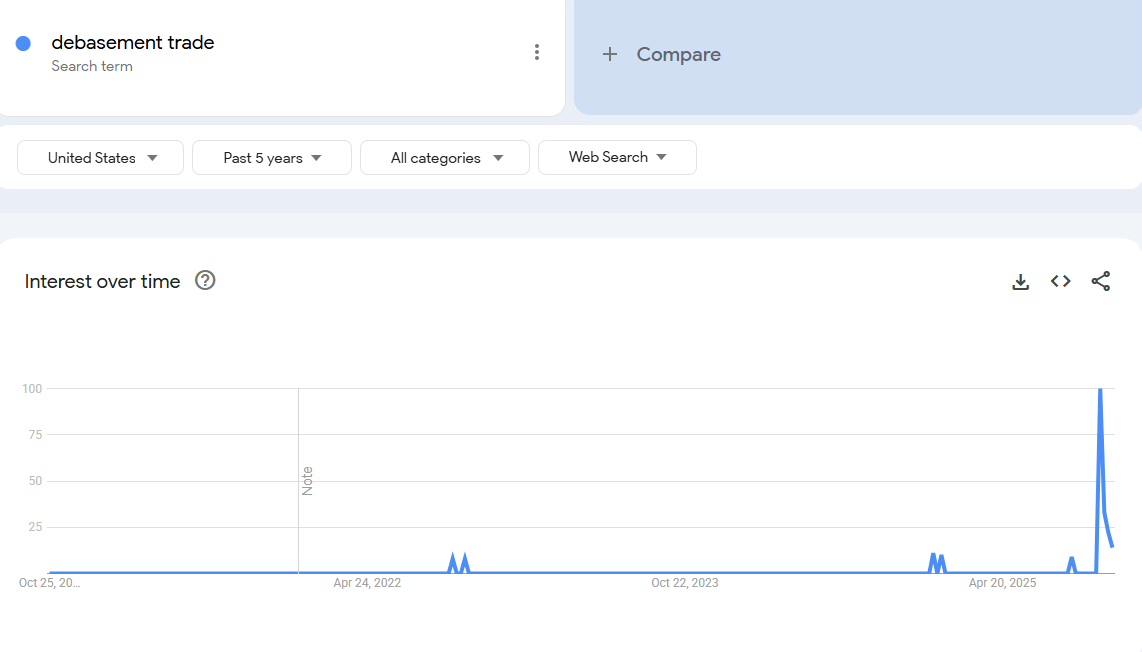
Data: Google Trends
we believe that “ the devaluation transaction ” the time of interest was a few years ago. at that time, the price of bitcoin was $25,000 and the price of gold was $2,000. there was no talk about it except for encrypted money and macroanalysts。
in our view, this “ the transaction ” is almost complete。
It is therefore our job to understand the conditions under which it was created and whether they will continue to exist。
What drove this deal? In our view, there are mainly two factors。
Ministry of Finance expenditure. During the Biden administration, we implemented a massive fiscal deficit。
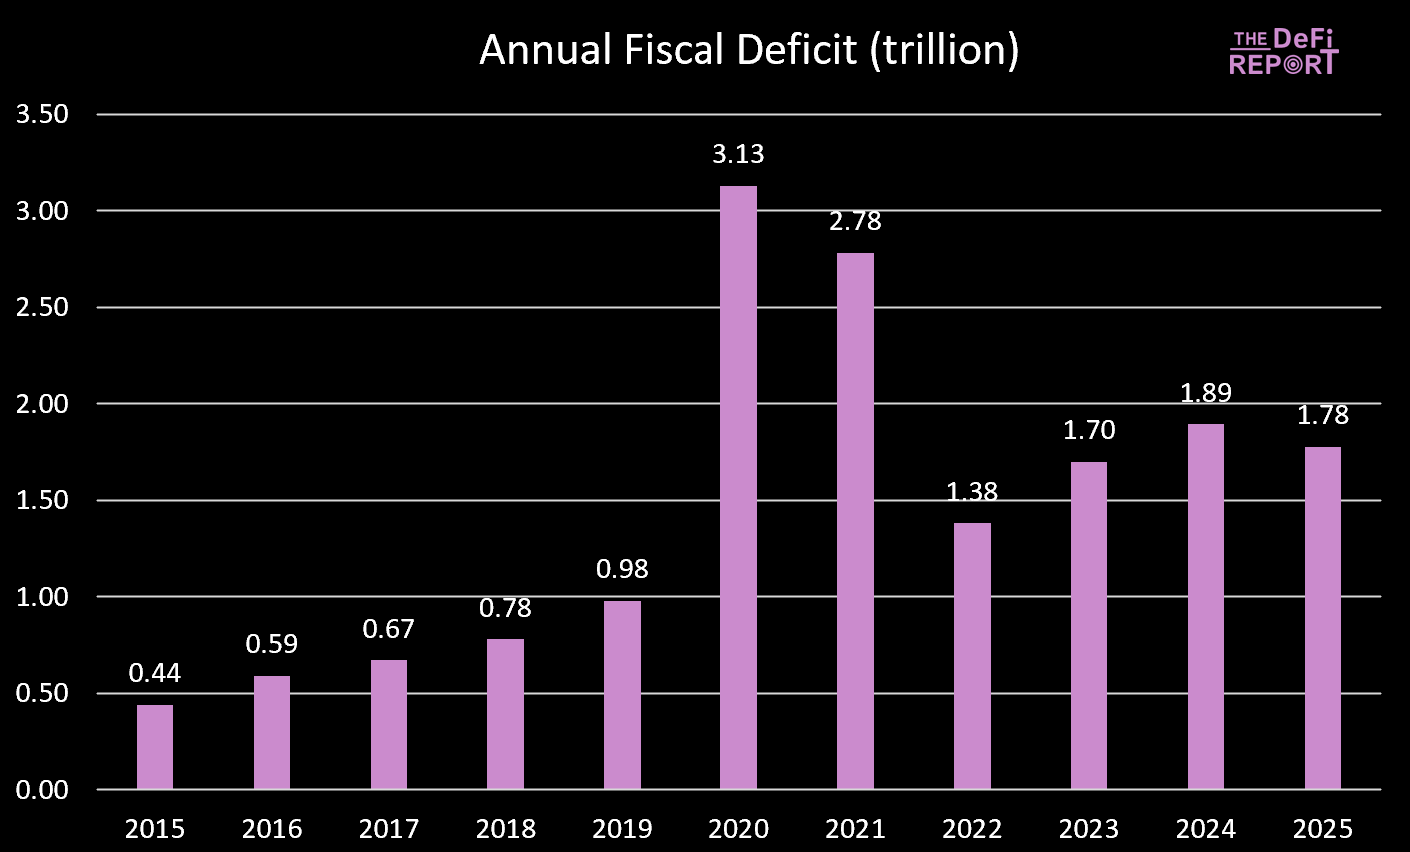
Data: US Treasury (United States Treasury)
The fiscal year 2025 had just ended and the deficit had fallen slightly — — this was mainly due to increased taxes (tariff duties) rather than reduced expenditures. However, the U.S. Bill (Big Beautiful Bill) is expected to achieve a reduction in expenditure through cuts in Medicaid and SNAP benefits。
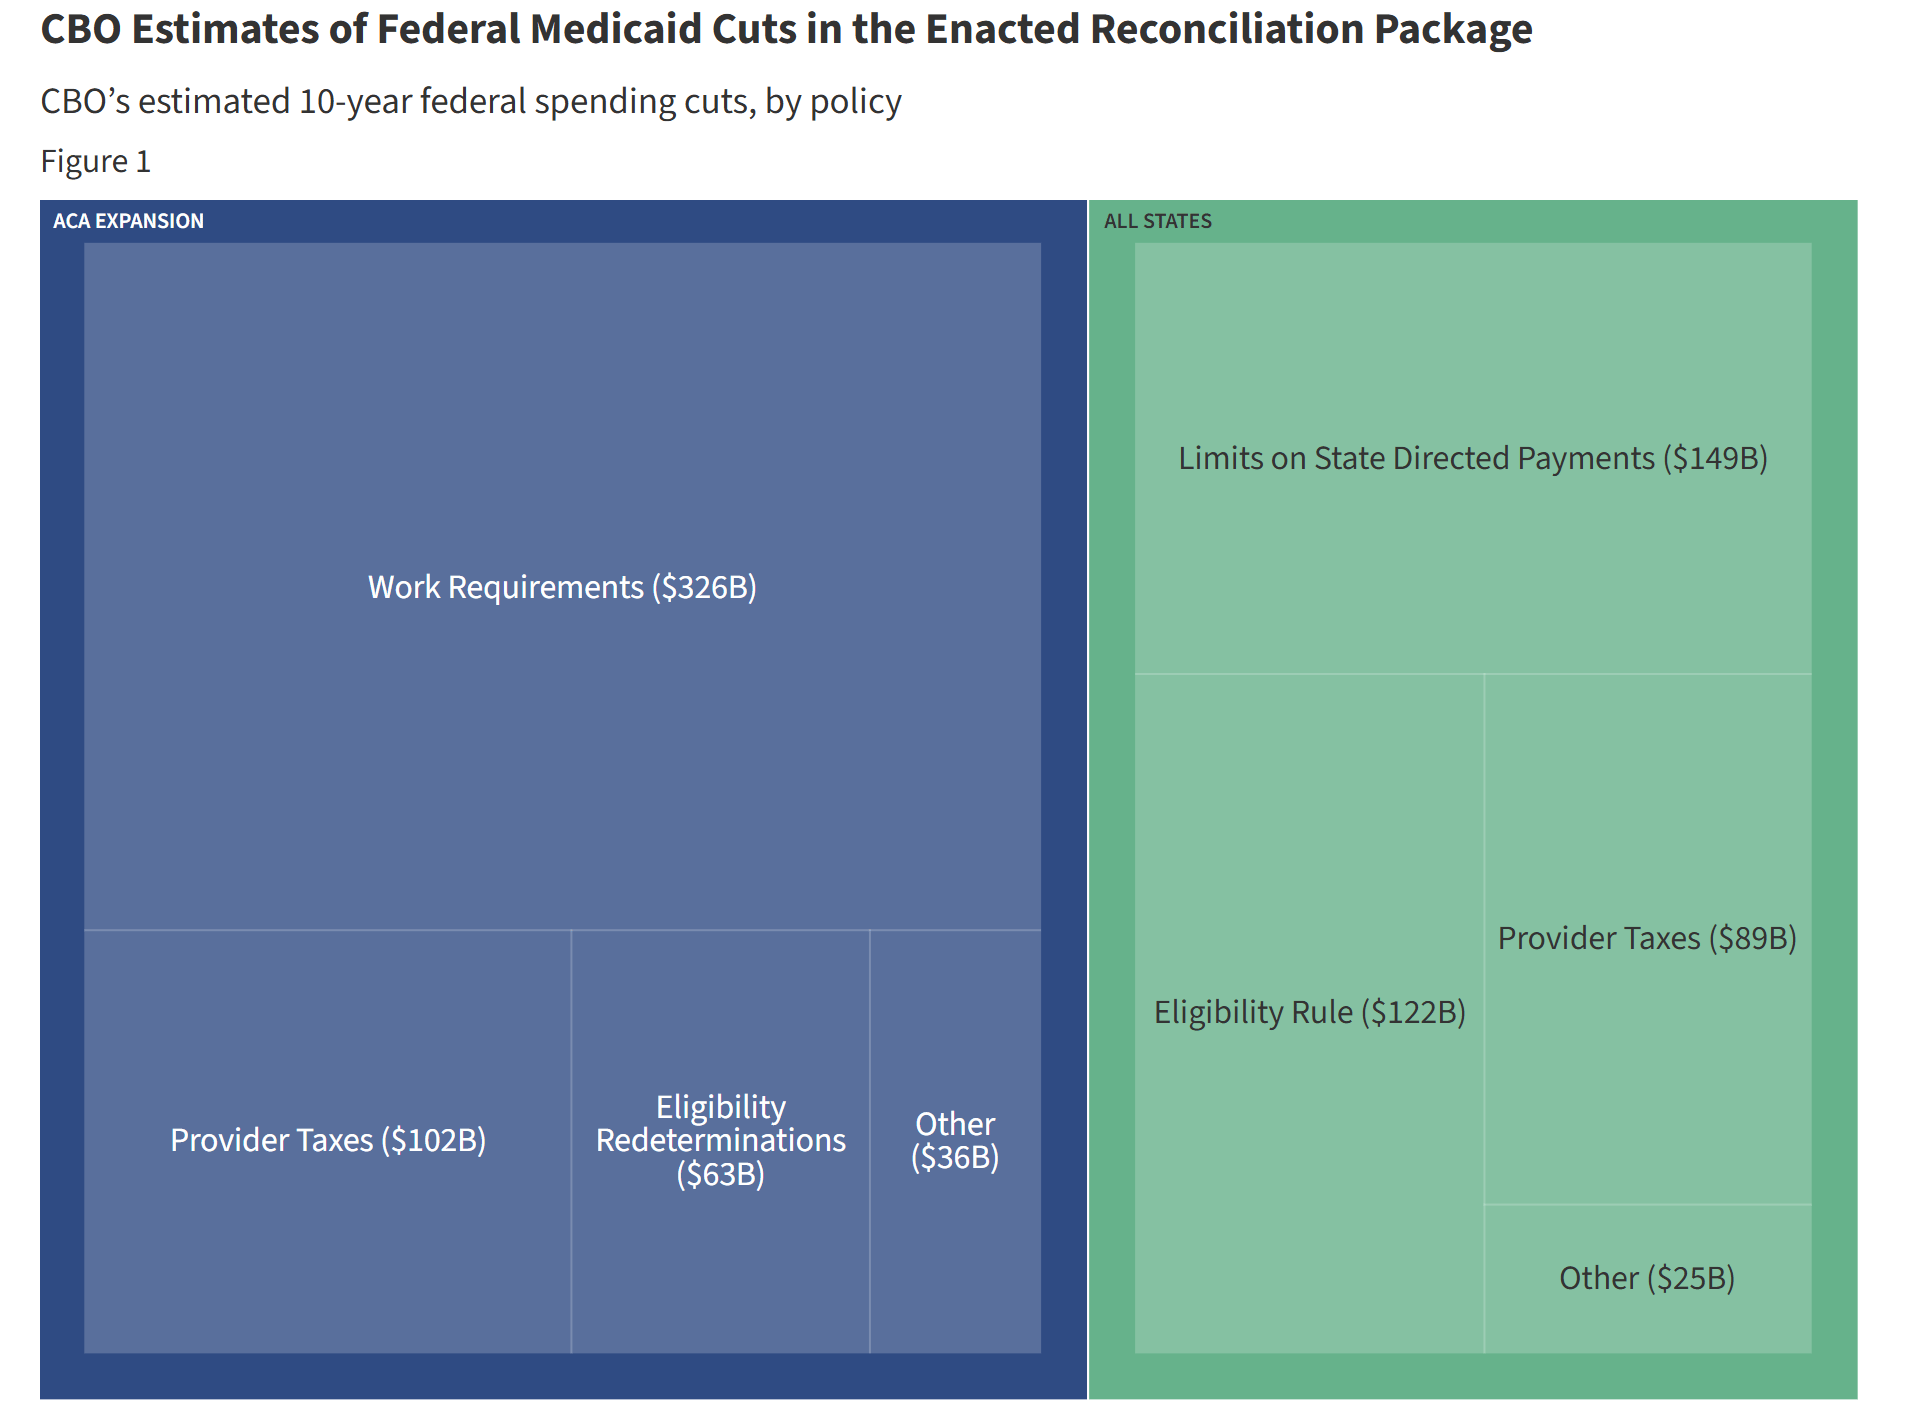
DATA: KFF (KAISER FAMILY FOUNDATION) CUTS COMPARED TO CURRENT EXPENDITURE TRAJECTORY
During Biden, government spending and transfers continued to inject liquidity into the economy. Under the United States Act, however, spending growth slowed。
This means a decrease in the Government ' s contribution to the economy。
In addition, the Government is drawing funds from the economy through tariffs。
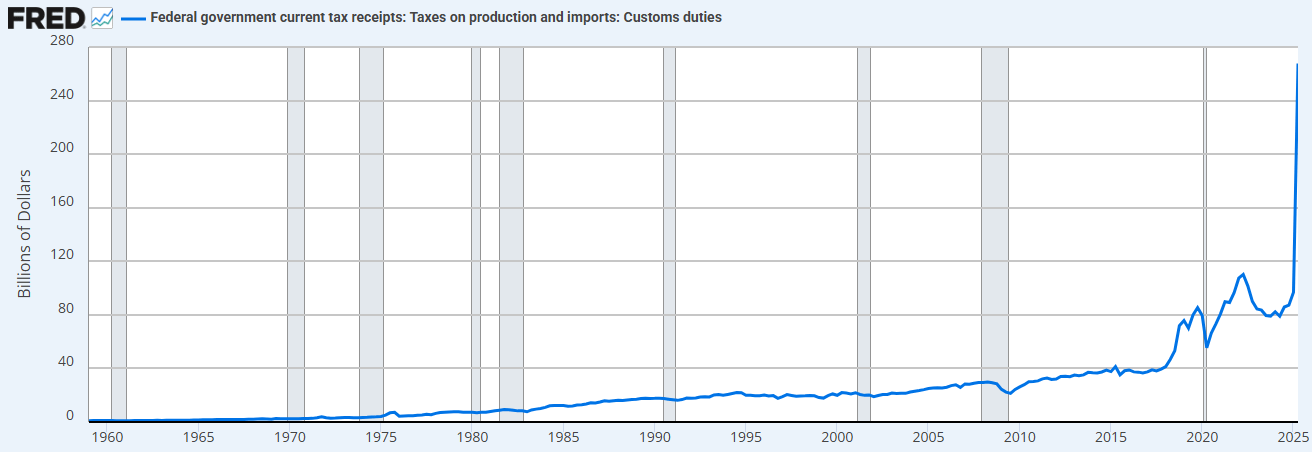
DATA: FRED (ECONOMIC DATA OF THE ST. LOUIS FEDERAL RESERVE)
The combination of spending restrictions (as opposed to the previous Government) and tariff increases means that the Ministry of Finance is now absorbing liquidity rather than supply liquidity。
That's why we need to cut interest rates。
& ldquo; we will privatize the economy, revitalize the private sector and narrow down the government sector. ” -Scott & Middot; Beckent
& ldquo; Quantified Ease & rdquo, Ministry of Finance (Treasury QE). In order to finance excessive spending by the Ministry of Finance during the Biden administration, we have also seen a new form of &ldquao; quantitative easing &rdquao; (QE). We can see this down there. & ldquo; Ministry of Finance QE & rdquo; financing government expenditure through short-term notes rather than long-term bonds, thus supporting the market。
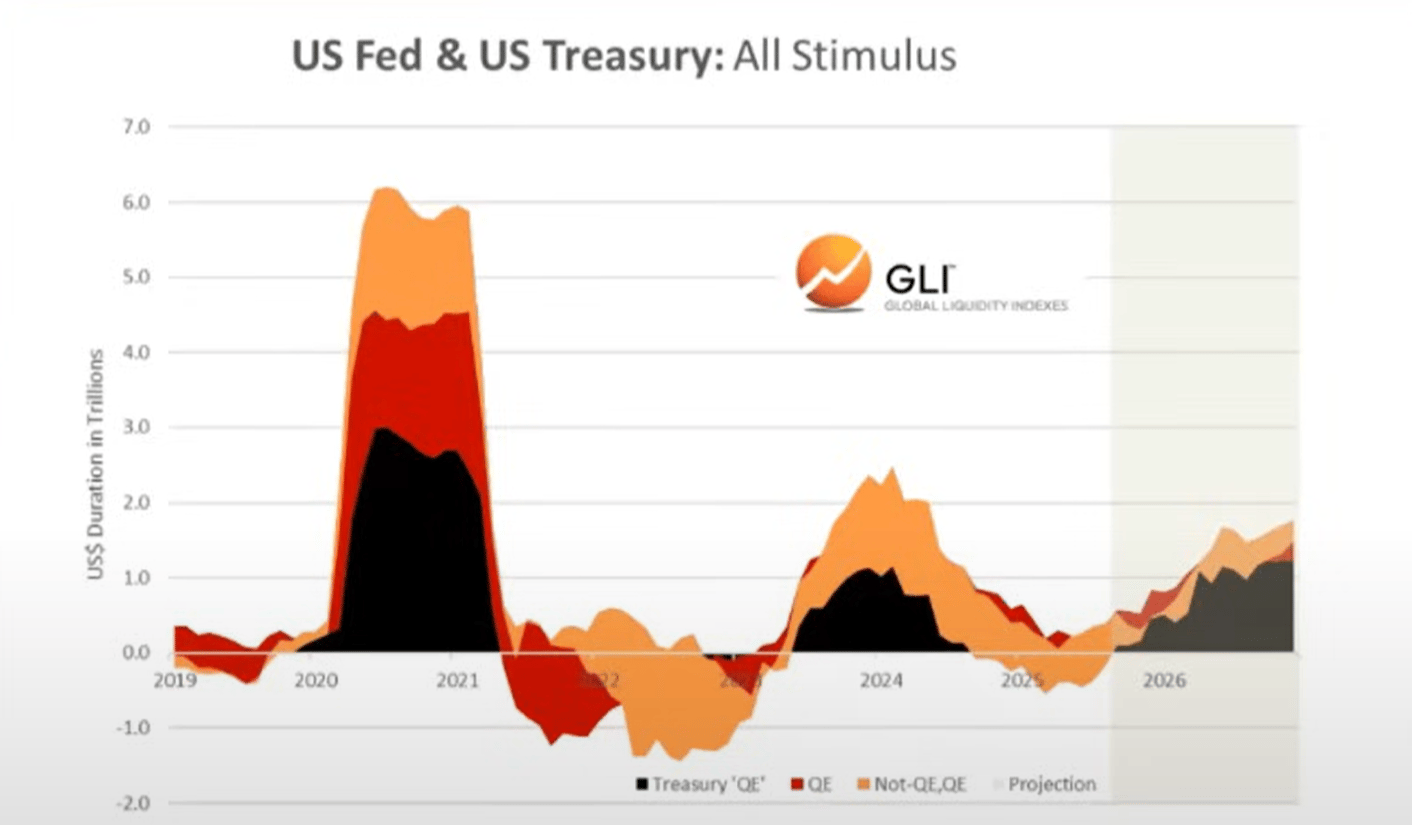
Data: Global liquidity index
it is in our view that it is fiscal spending and quantitative easing that have driven the formation of what we have seen in the past few years “ devaluation transactions ” and “ everything bubbles ” “ everything bubble and rdquo;)。
but now we are moving to “ the trump economy ” and the private sector is taking over the baton from the ministry of finance。
Likewise, that is why they need to reduce their interest rates. Private sector activation through bank loans。
As we enter this transition, the global liquidity cycle seems to be at its peak...
The global liquidity cycle is falling
Current and average cycles
Below, we can observe a comparison between the current cycle (red line) and the historical average since 1970 (grey line)。
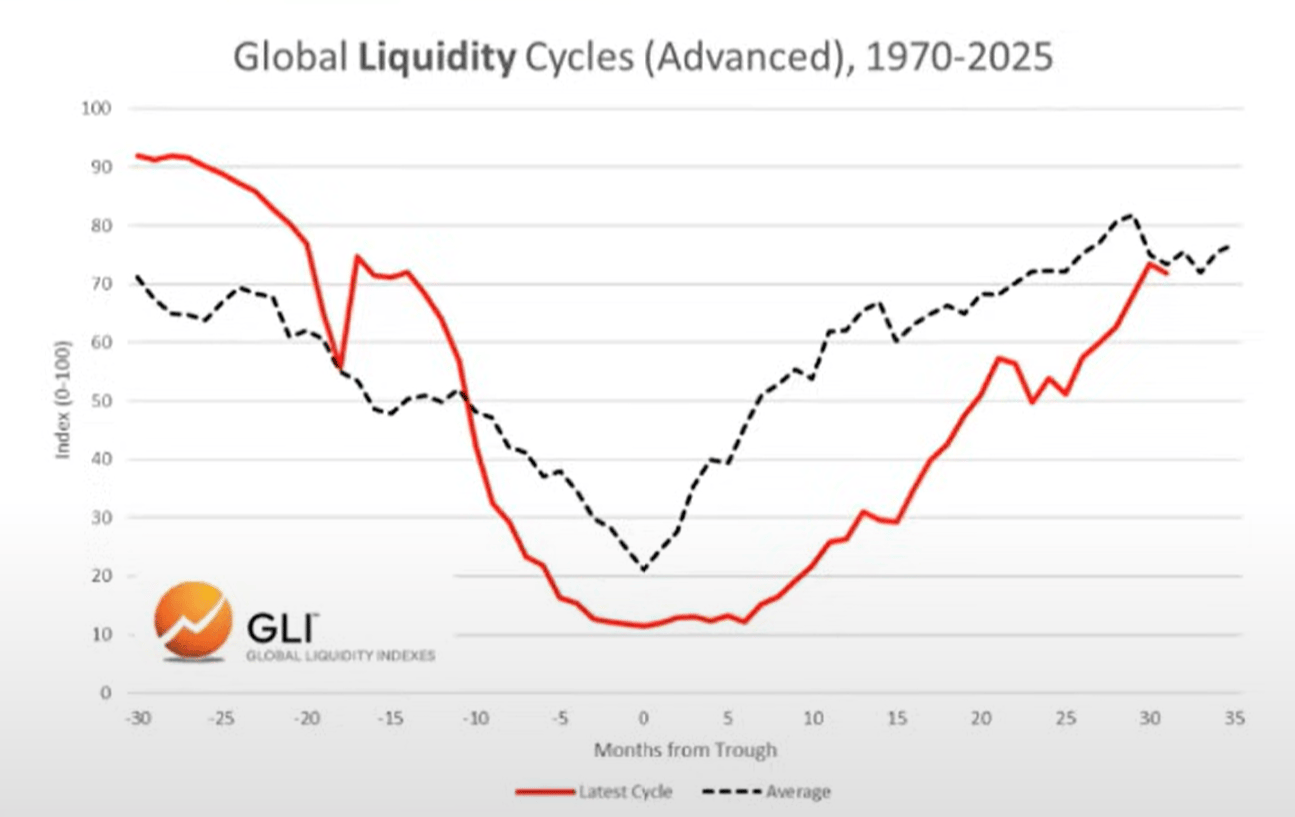
Data: Global liquidity index
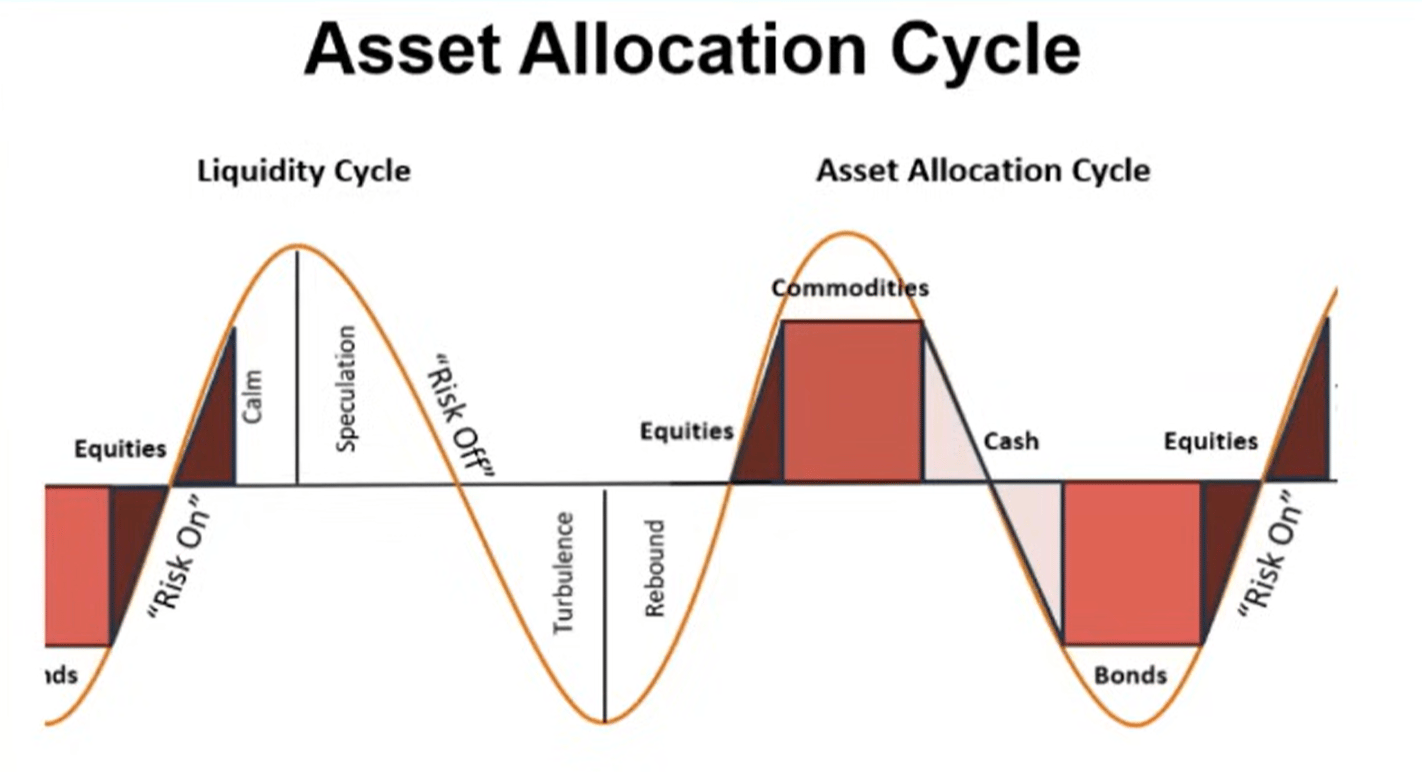
Asset allocation
Based on Mr. Howell ' s work on the Global Liquidity Index, we can observe the typical liquidity cycle and its compatibility with asset allocation。
Large commodities are often the last to fall assets, as we see today (gold, silver, copper, gold)。
From this perspective, the current cycle seems very typical。
Data: Global liquidity index
well. if liquidity is indeed at its peak, we expect investors to rotate into cash and bonds as the environment changes. it needs to be made clear that this part of the process has not yet begun (market still & ldquo; risk preference & rdquo)。
Debt and liquidity
According to the Global Liquidity Index, the debt-to-liquidity ratio of major economies reached its lowest level since 1980 at the end of last year. It is now rising and is expected to continue up to 2026。
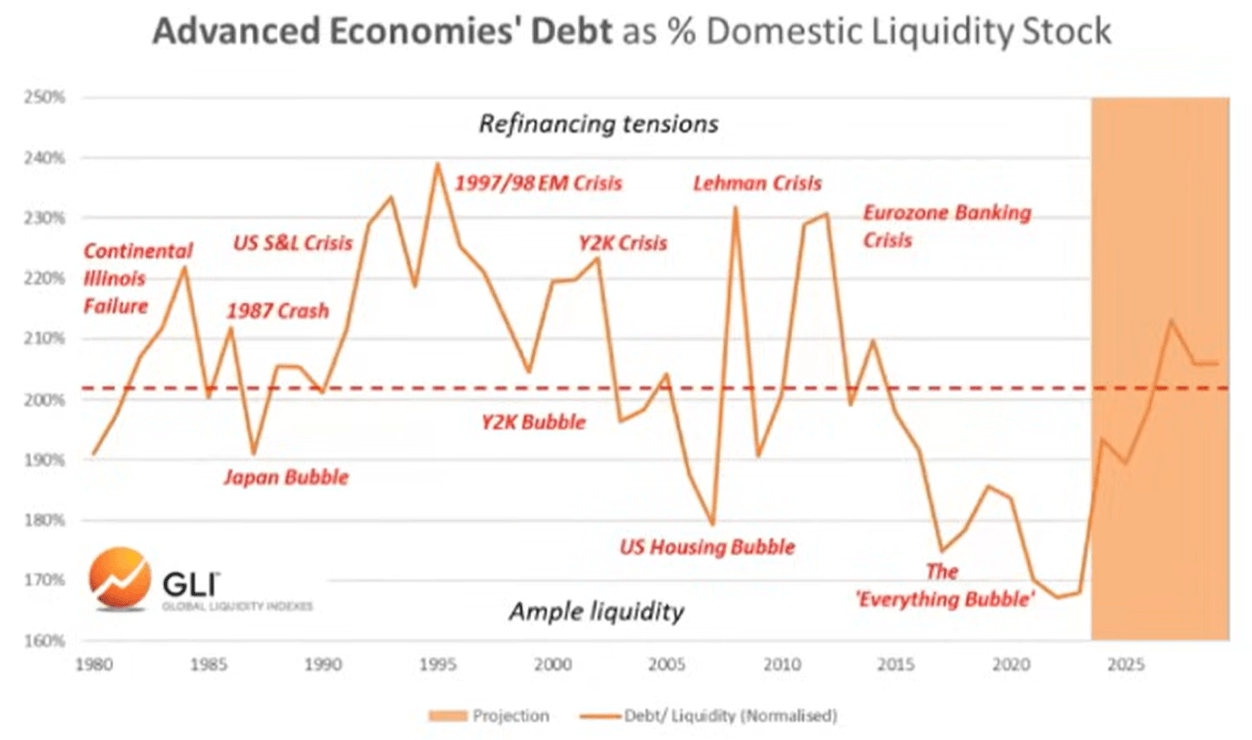
Data: Global liquidity index
The increase in the debt-to-liquid ratio made it more difficult to provide services for the trillions of dollars of outstanding debt that required refinancing。
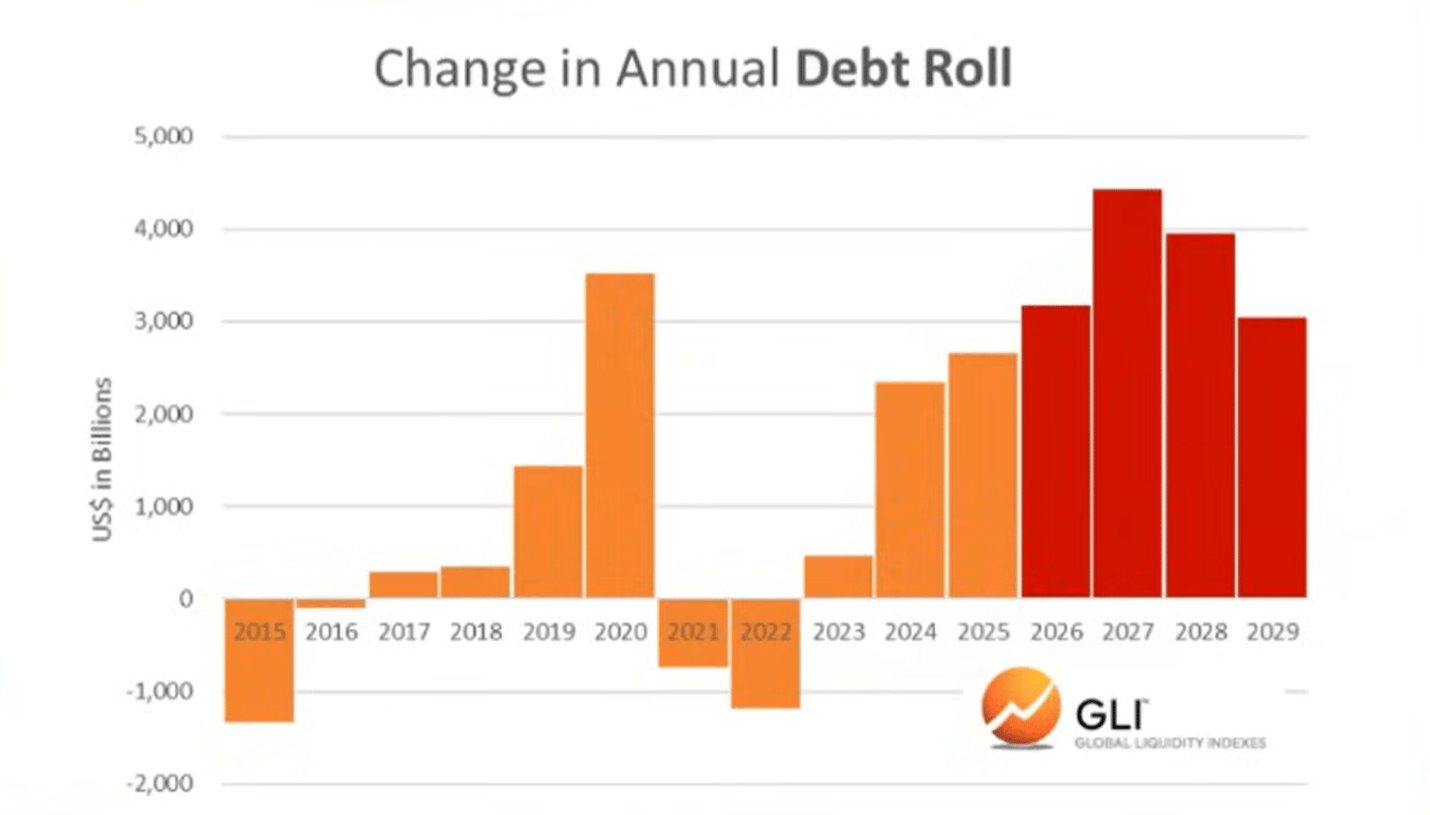
Data: Global liquidity index
Bitcoin and global liquidity
of course, bitcoin has been at the top of global liquidity in the last two cycles, “ foreshadowing &rdquo. in other words, bitcoin peaked a few months before its peak in liquidity, and appears to have anticipated a subsequent decline。
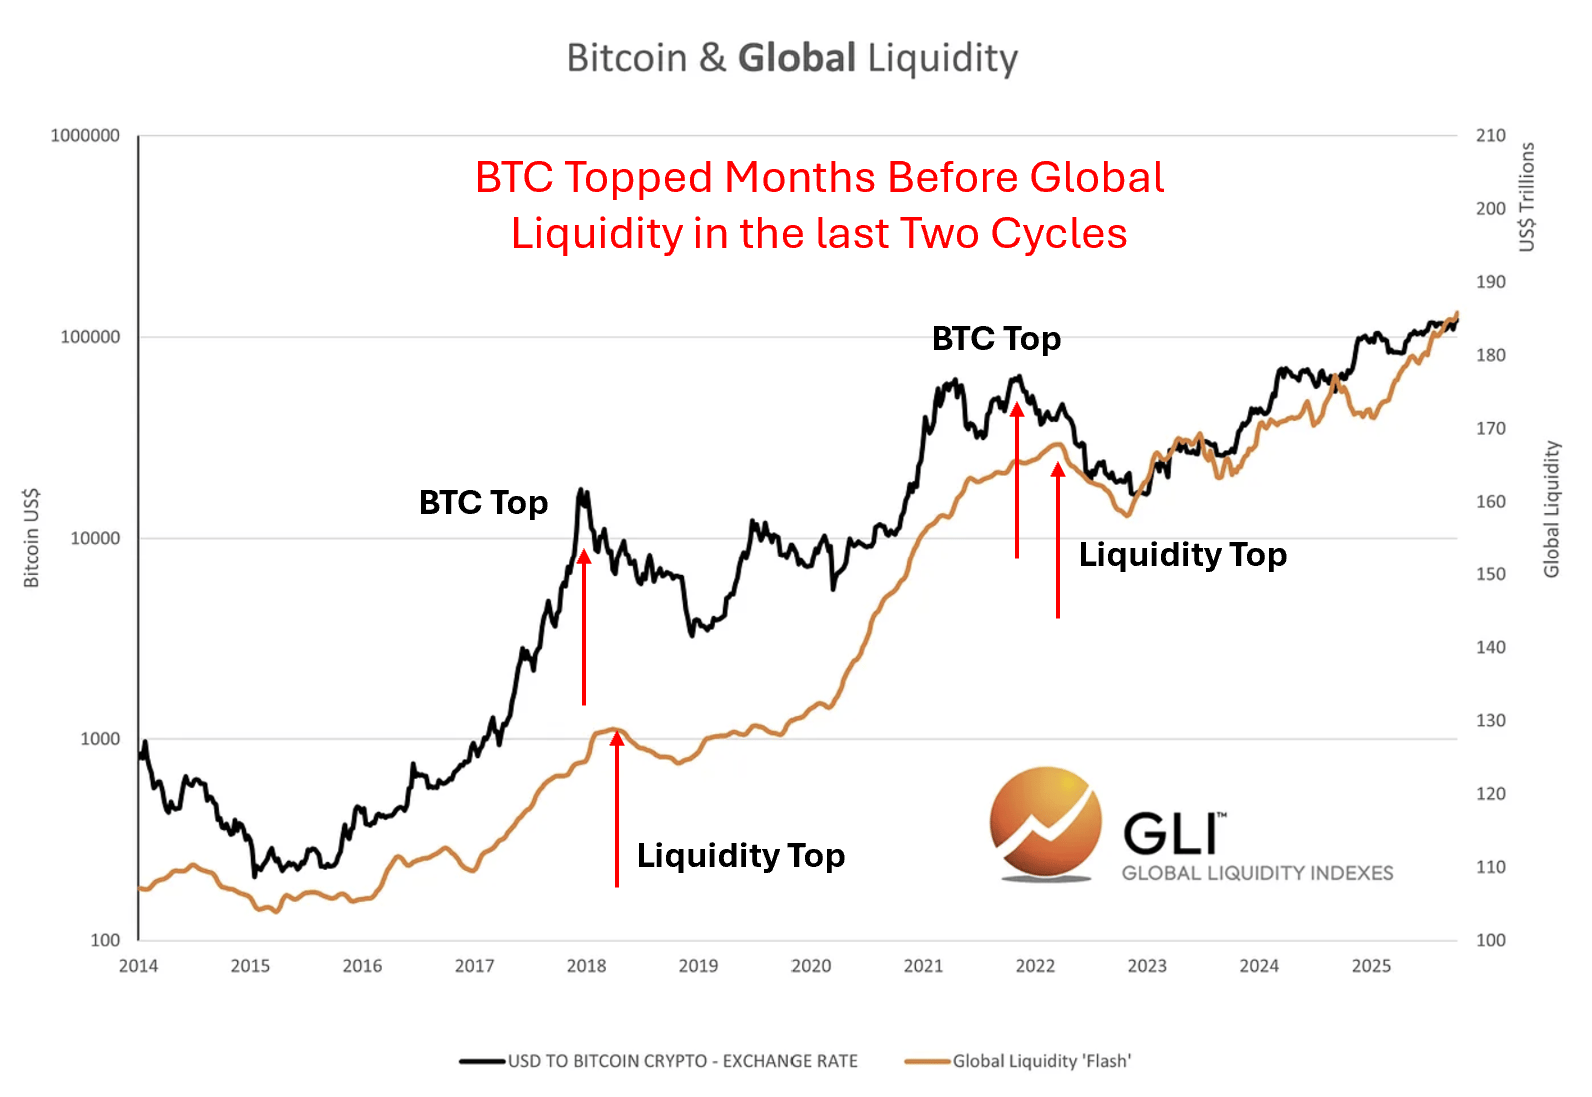
Data: Global liquidity index
We don't know if this is happening right now. But we do know that encrypted currency cycles follow the liquidity cycle。
Consistency with encrypted currency cycles
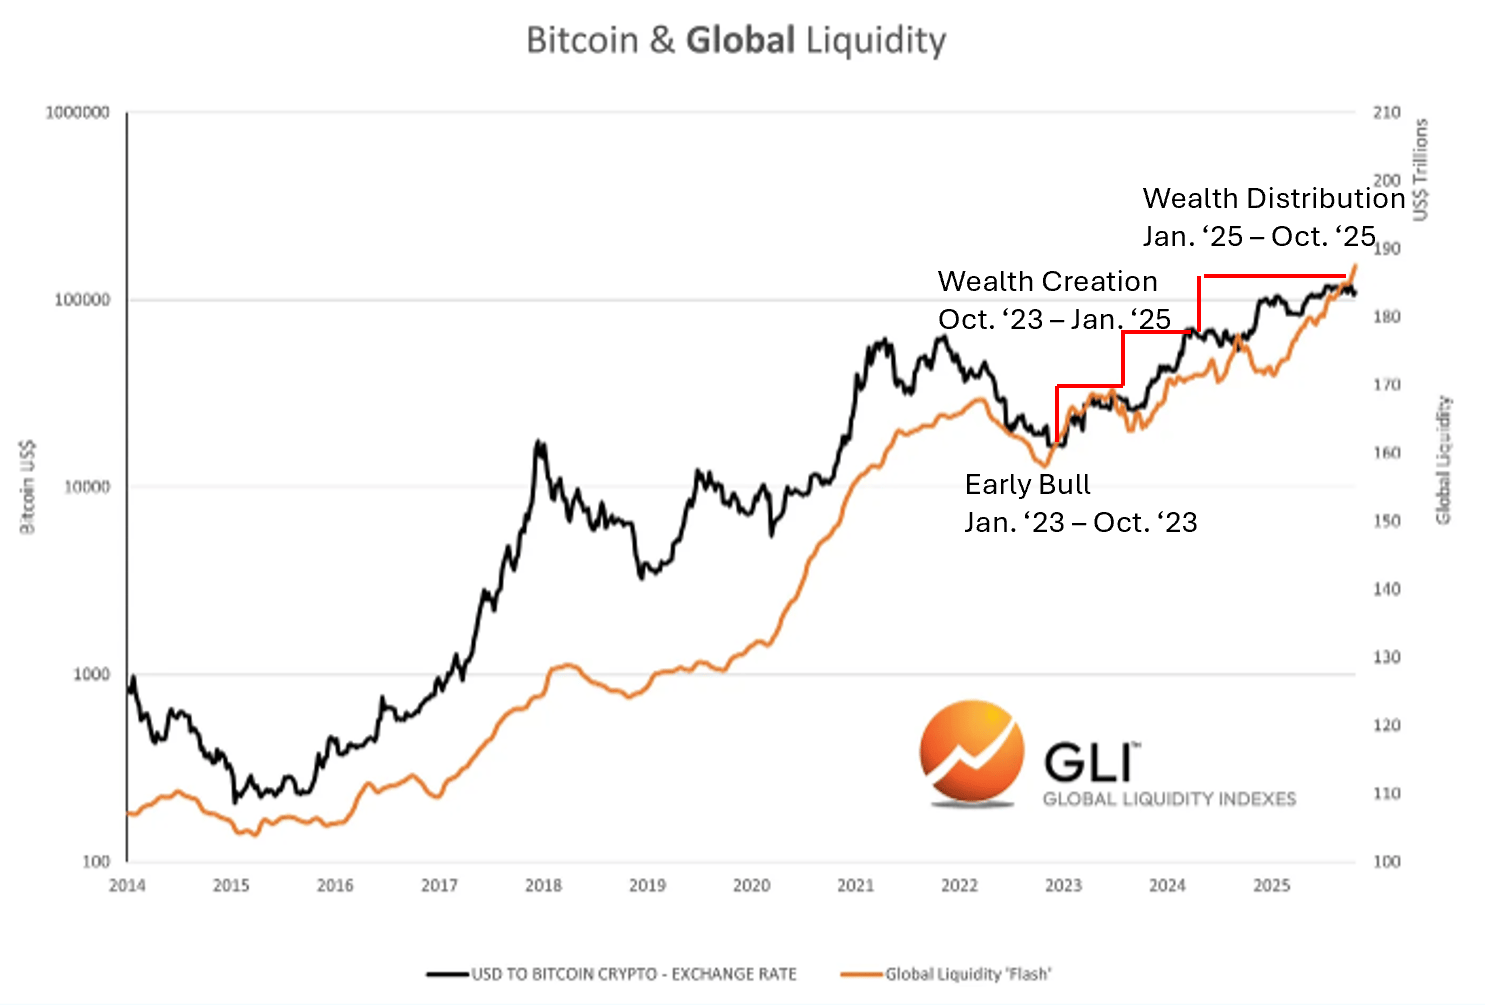
Data: Global liquidity index