
Bitcoin has returned, but $80,000 in resistance and profit margin or bottlenecks
Markets seemed to be moving towards a more constructive phase, but still needed to be recognized. 。

Photo by Glassnode
Original: AididiaoJP, Foresigh News
BITCOIN RETURNS $78,000, WITH SPOT DEMAND AND THE RETURN OF ETF INFLOWS. THERE IS A POTENTIAL FOR EMPTY SQUEEZING WITH AN INCREASE IN EMPTY SPACE AND A NEGATIVE FINANCIAL RATE. HOWEVER, HIGH PROFITS AND SOFT VOLATILITY HAVE BEEN ACHIEVED, IMPLYING CAUTION AND RESISTANCE OF $80,000。
Summary
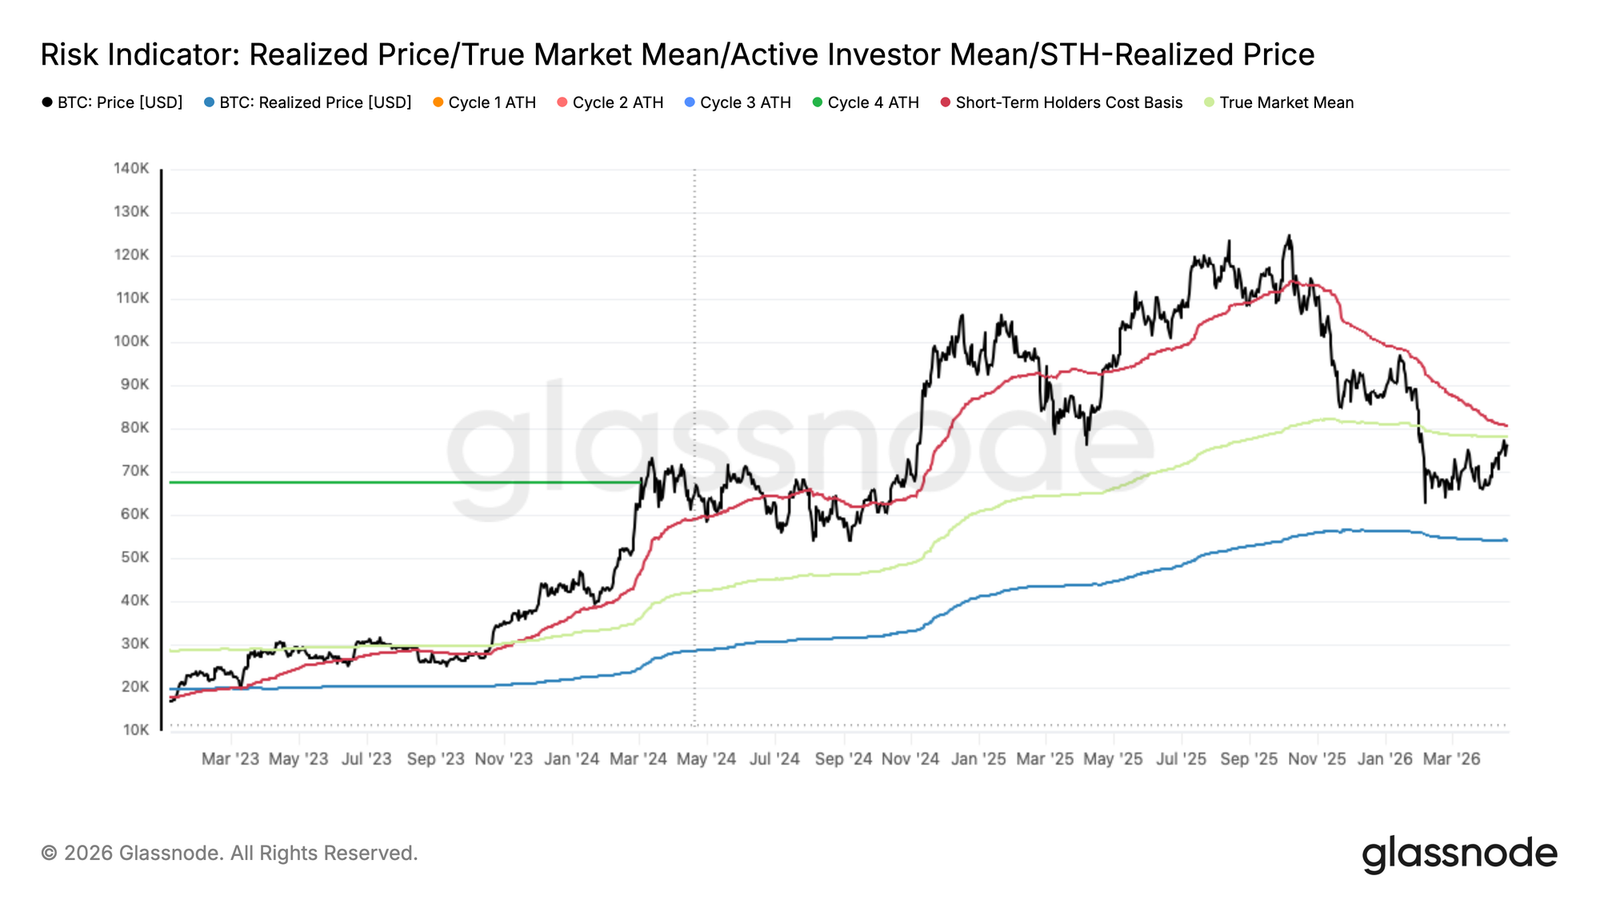
Bitcoin has broken the real market average (True Market Mean) of $781 million, the first significant return of the average since mid-January, and the short-term holder cost base (Short-Term Holder Costa Basis) is currently at $80.1 million, making it the limit of immediate resistance。
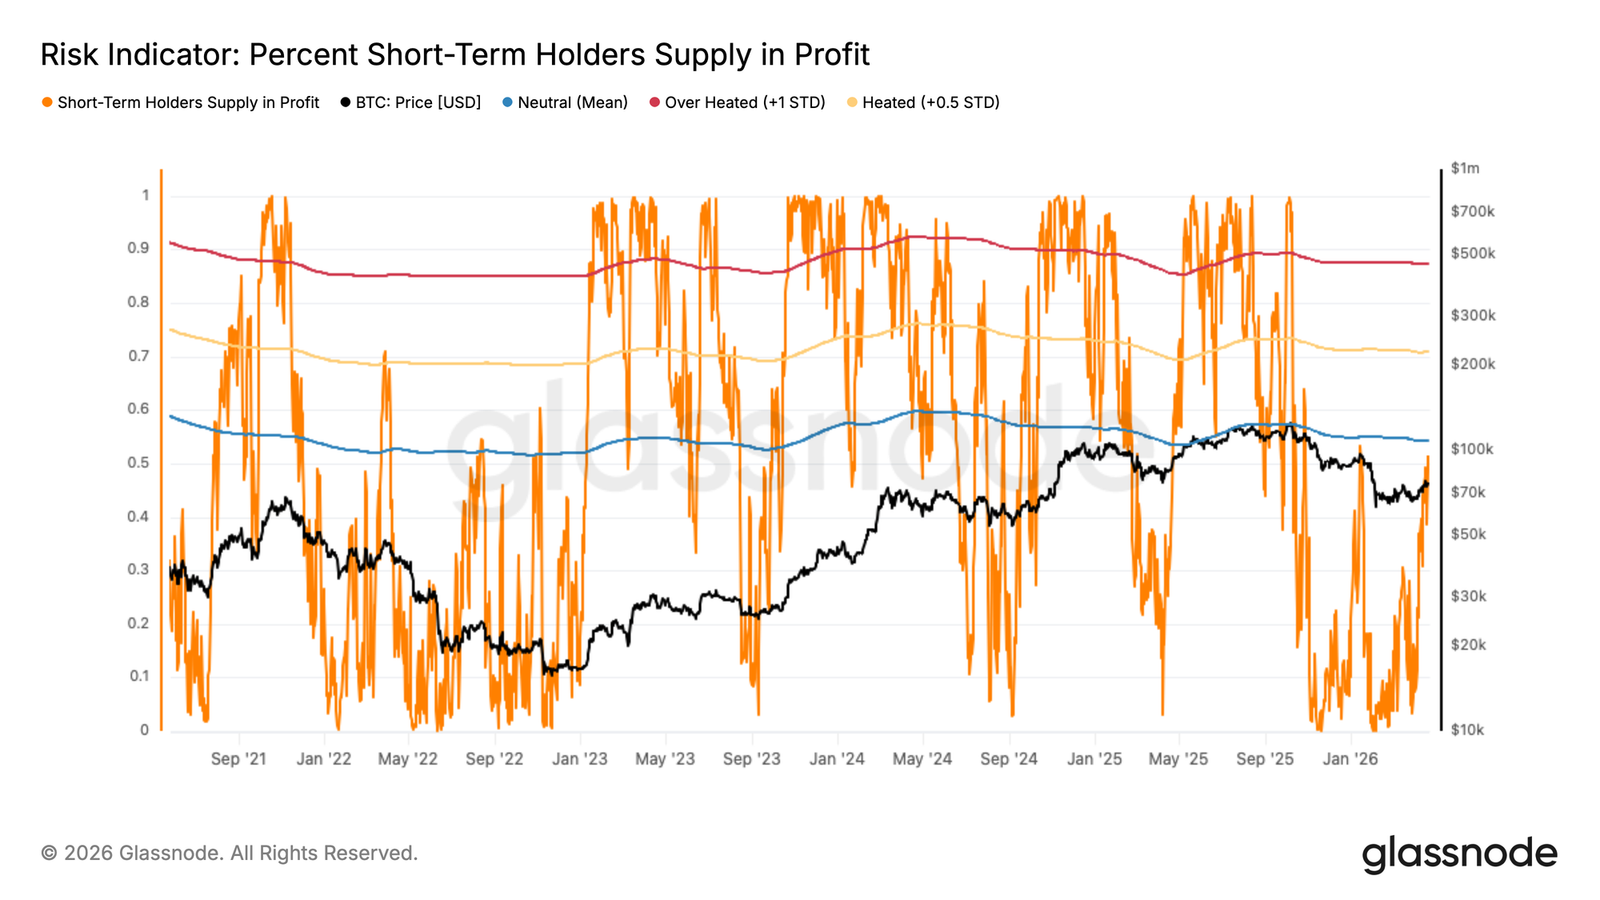
A rebound of $80,000 would allow more than 54 per cent of the recent buyers to enter the profit zone, a threshold that historically often marks a run-down node in the bear City rebound, the second time that a similar structure has emerged in the current cycle。
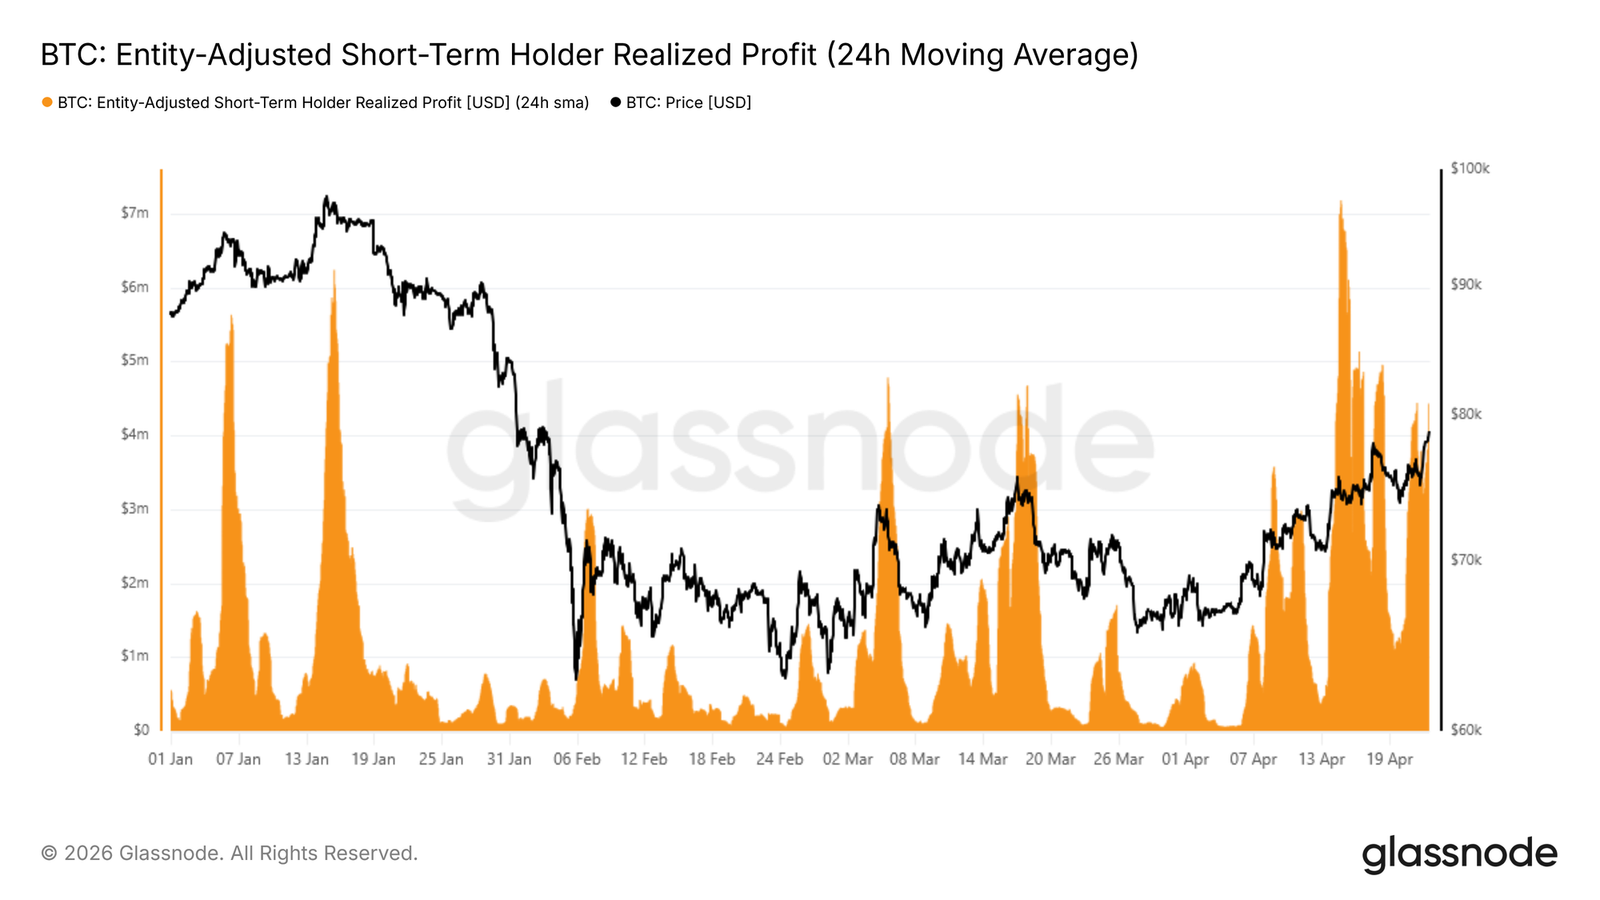
Short-term holders ' realized profits have soared to $4.4 million per hour, almost three times the $15,000 threshold for each local top so far this year. In the absence of meaningful demand catalysts, caution is needed。
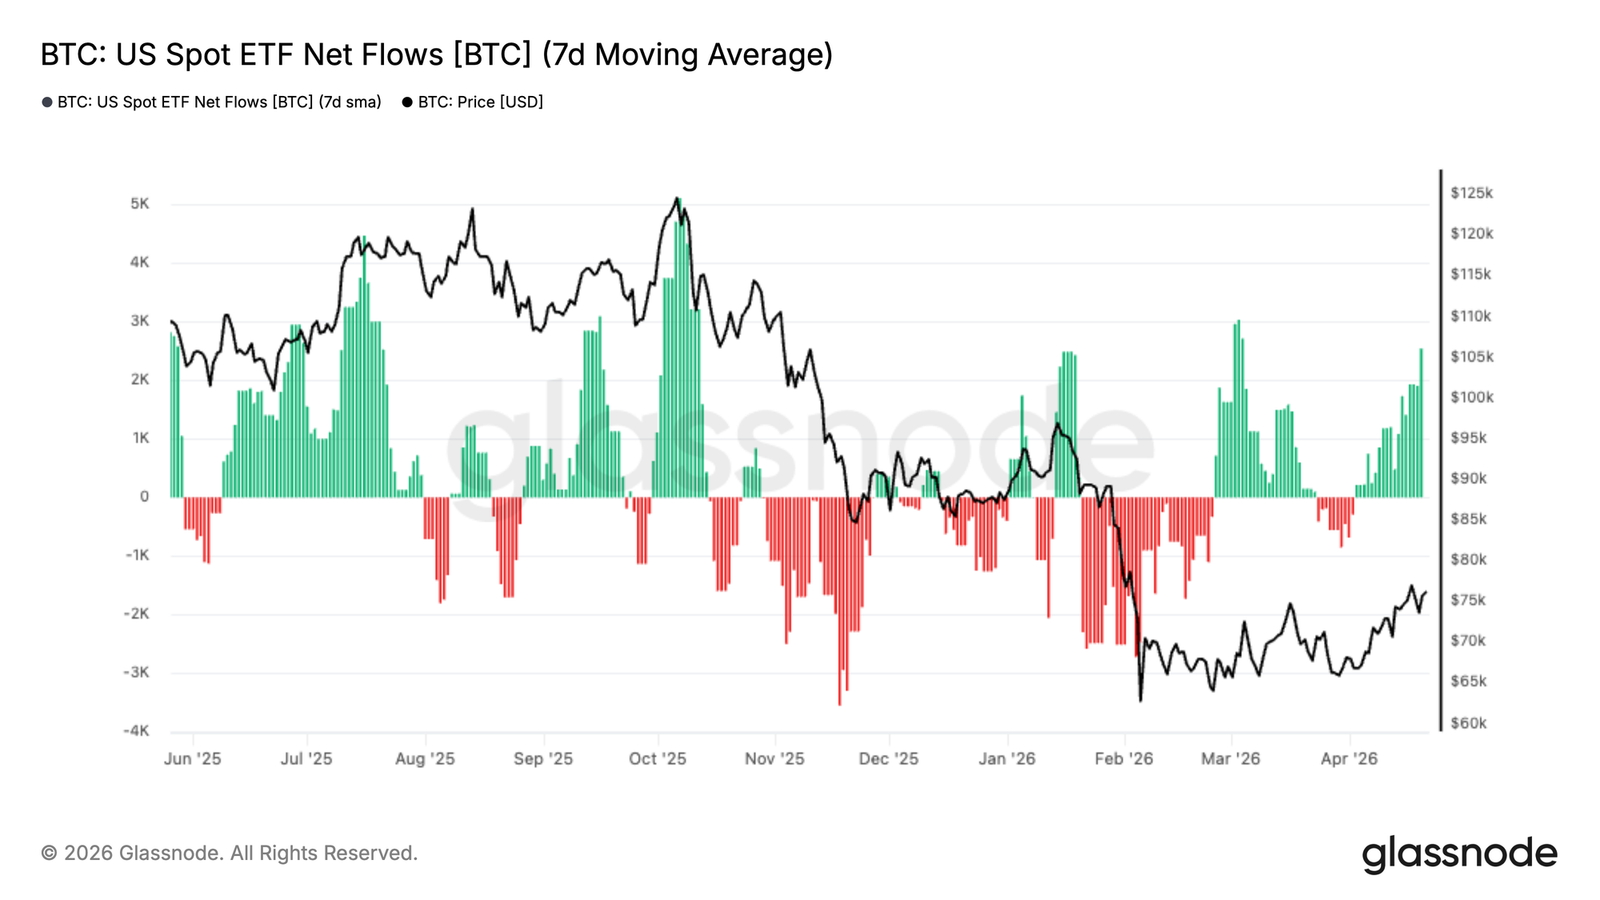
ETF FINANCIAL FLOWS REVERTED TO A MODERATE POSITIVE VALUE AND THE MOVING AVERAGE LINE RETURNED TO THE INFLOW ZONE ON 7 DAYS, INDICATING THAT THE INITIAL RETURN OF INSTITUTIONAL NEEDS BEGAN AFTER A LONG PERIOD OF OUTFLOWS。
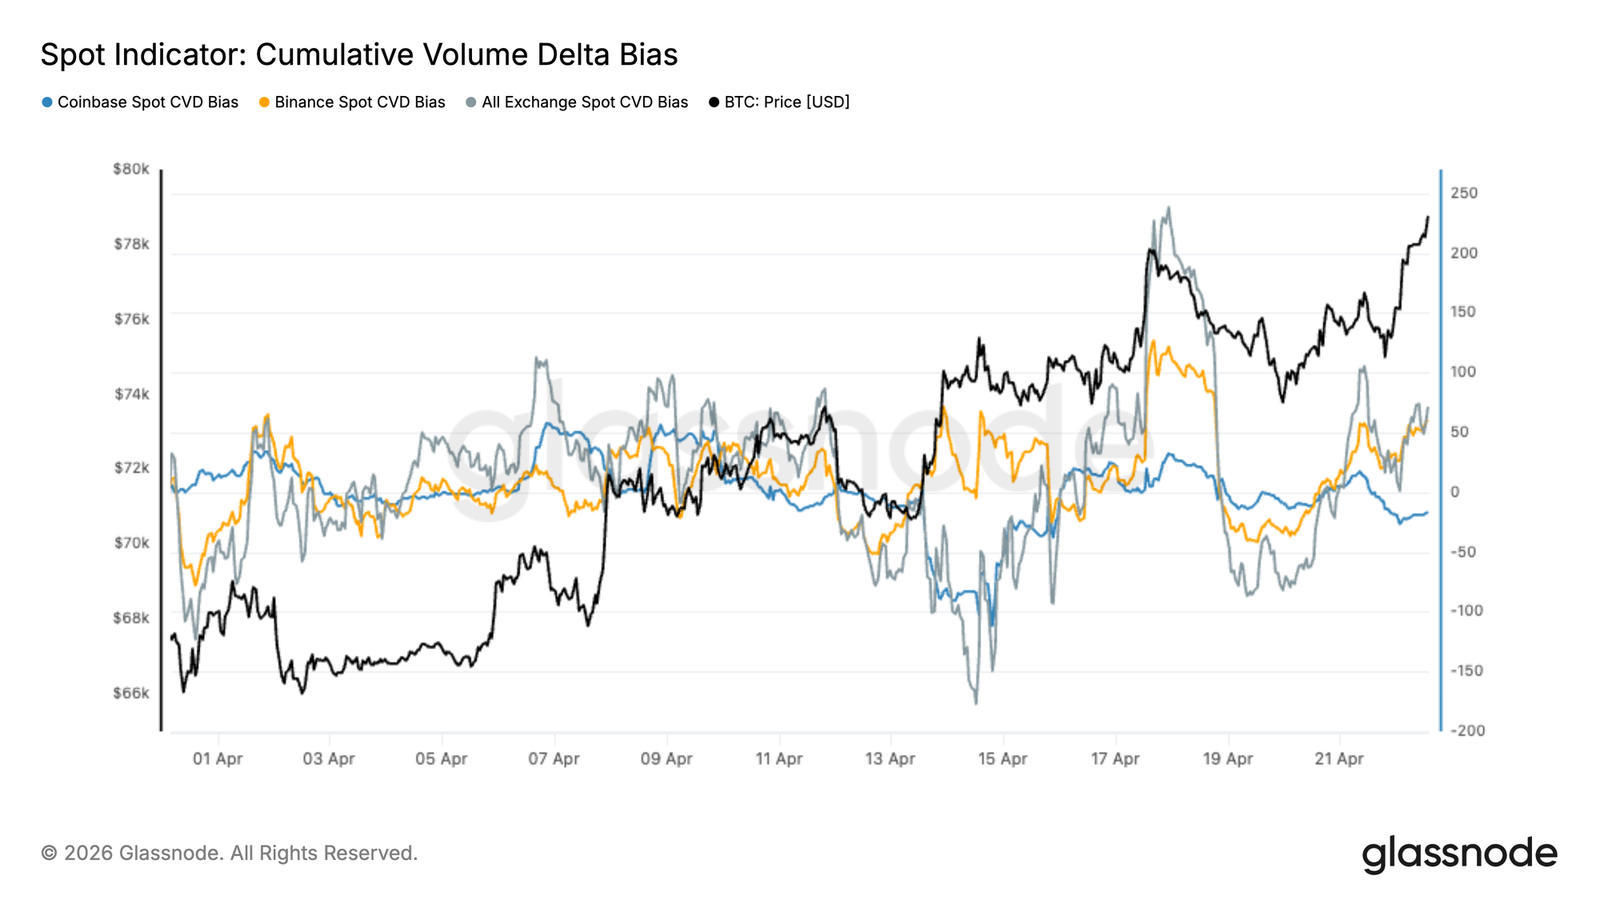
the emerging demand shows signs of early recovery, with the cumulative amount of delta moving to positive values, indicating an increase in the aggressiveness of buyers, especially at offshore trading sites。
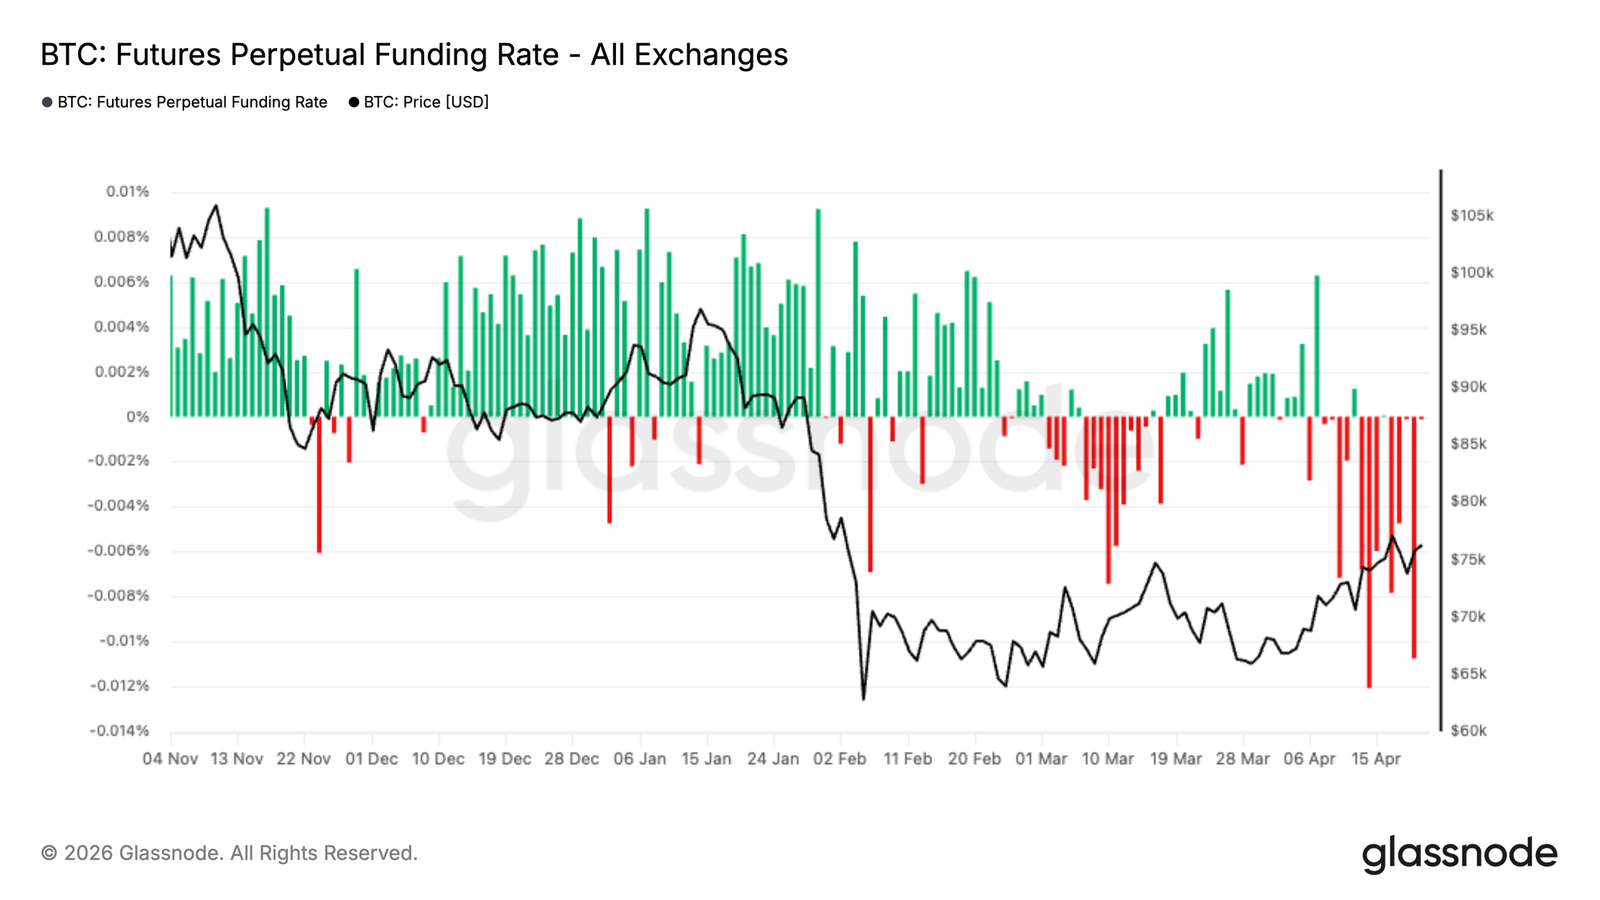
The persistence of negative rates of funds for sustainable contracts reflects the increasing market bias towards empty positions, which could become an upward fuel if spot demand continues to grow。
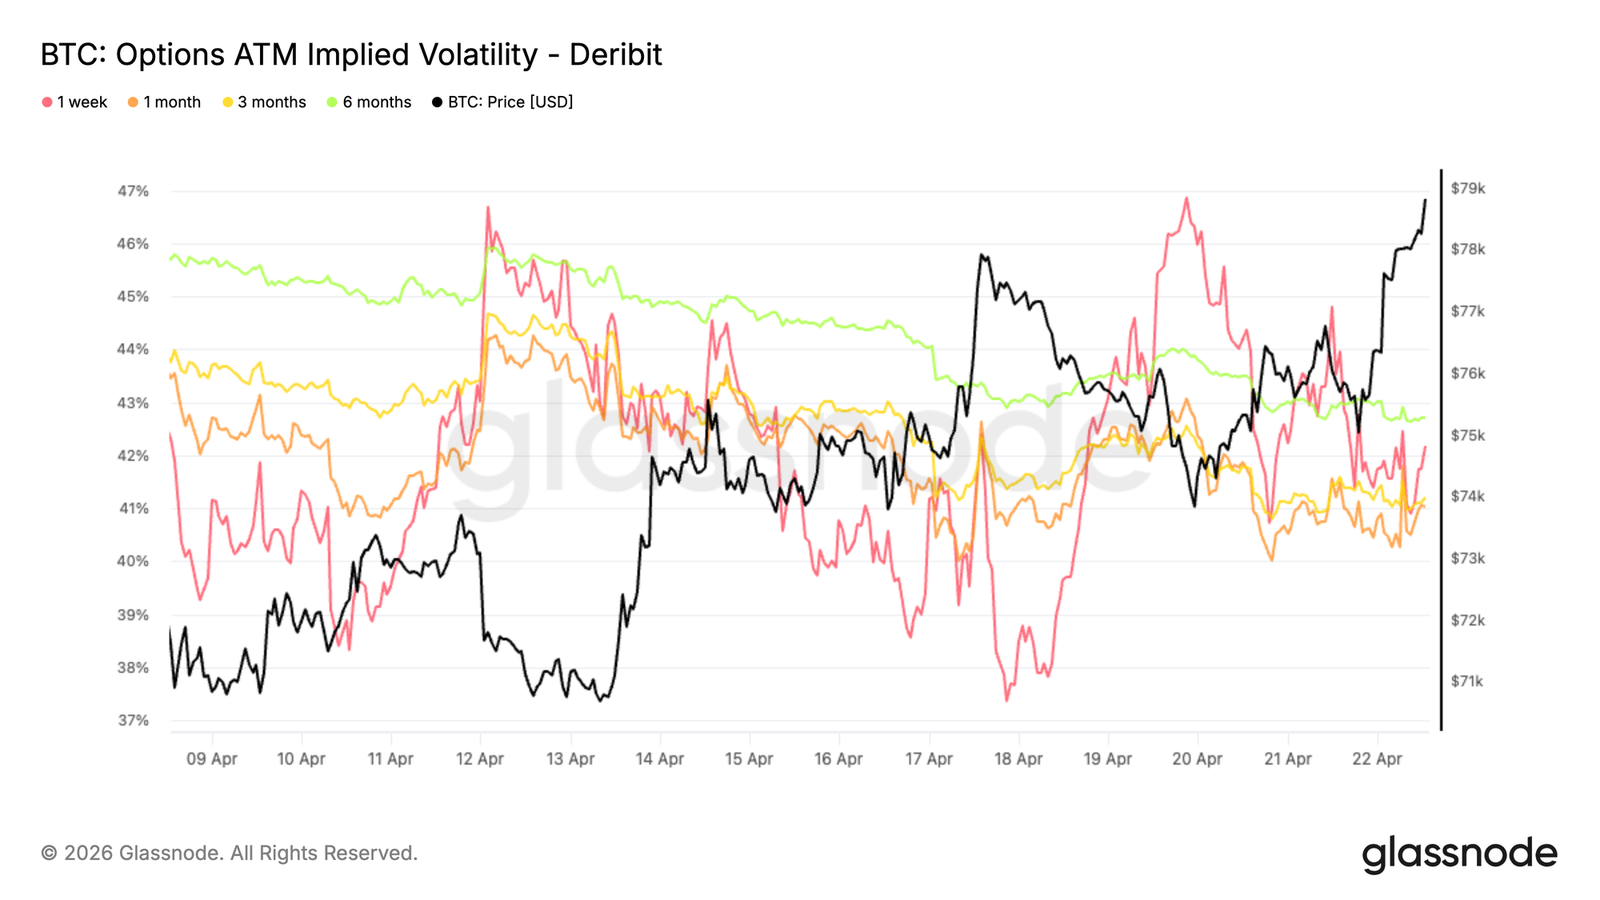
Volatility is under constant pressure. Implied volatility continues to decline, the realized volatility has been confirmed, and there is no premium in options pricing。
The deviations show short-term repositioning, but further downside protection remains firmly bought。
Gamma and the flow of funds sketched out the current pattern: the top was faced with mechanical resistance near $80,000, while the downside risk was higher for $75,000。
Insight on the chain
Breaking the ceiling but not yet clear
Last week, the present report identified the real market average of $781 million as a short-term resistance zone, and it is expected that underwater investors' volatilization will limit any rebound. Bitcoin has since surpassed that level, and this development is of major cyclical significance。
Real market averages track the cost base of dynamic trade supply, and the historical recovery of the model often marks a transition from deep bear market conditions to more constructive markets. The breakthrough represents a significant return of the current bear market, with the next logical goal being a short-term holder cost base of $805 million。
However, the fallout of investors accumulated in the 60,000-70,000 United States dollars zone is beginning to affect the momentum, as this group is approaching the balance point of gains and losses and facing behavioural incentives to exit. This development increases the probability of forming a local top in the short term, and while breaking the real market average is constructive, caution remains to be exercised。
Next wall: short-term holder cost base
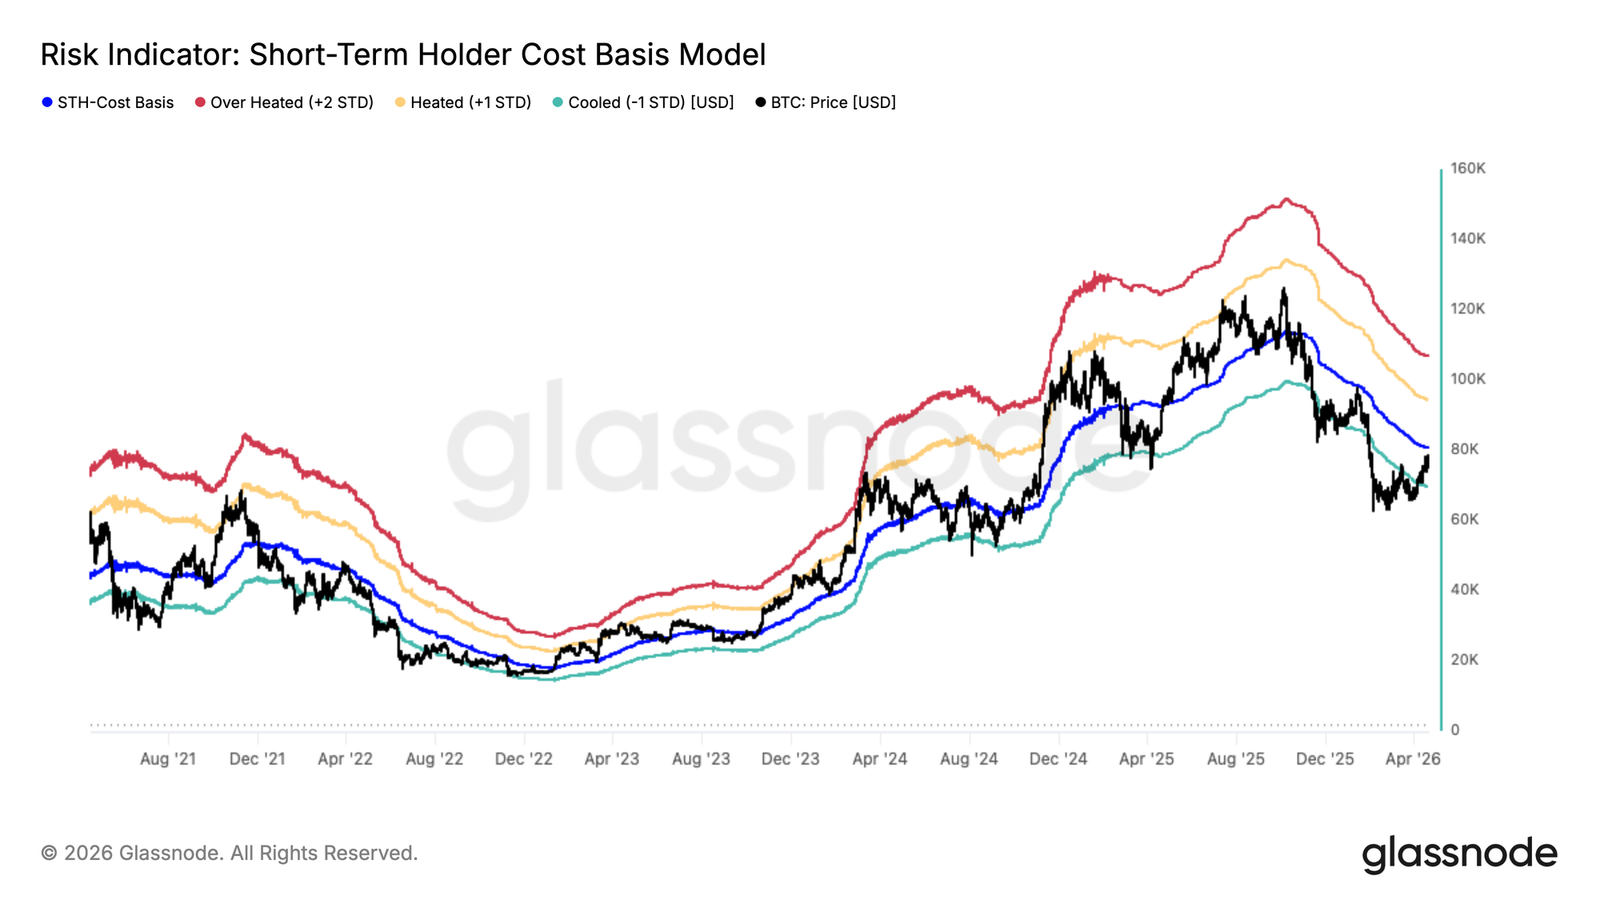
After breaking the real market average, the market is now facing the next more severe test. The short-term holder cost base of $8.01 million represents the average purchase price of the investor over the past 155 days, a group that has historically proved to be the most price-sensitive group in the market。
As prices approach their balance of earnings and losses, the behavioural incentive to exit increases, making the region a natural source of pressure. In Bear City, the rebound to the short-term holder ' s cost base usually takes several attempts to resolve, with prices falling around -1 standard deviations (approximately US$ 699 million). This model shows that $78,000 - $801 million represents important short-term resistance, while $70 million is increasingly becoming the medium-term underpinning of development。
Bear City bounced away
As the short-term holder cost base of $8.01 million has become the limit of immediate resistance, the ratio of profit to short-term holder supply (Percent of Short-Term Holder Superly in Profit) provides a complementary perspective that accurately explains why this level is so important for behaviour. This indicator measures the proportion of recent purchases that are currently not profitable, with historical readings of more than 54 per cent, and tends to overlap with the middle peak of the bear City rebound, as short-term holders of profits are sufficiently concentrated to overwhelm demand。
The rebound to the $80,000 region will simultaneously drive the indicator to exceed its statistical average by 54 per cent, prompting the recent wave of profits that buyers have seized the opportunity to exit near the balance of gains and losses. It is worth noting that this is not an isolated event in the current cycle; it is the second time that such a structure has emerged, following similar developments in Bear City. This threshold has been repeatedly touched upon to enhance its reliability as a local top indicator。
Proof warning for profit surge
These depleted signals are further reinforced by the fact that real-time spending by short-term holders is certifying the structural landscape. With the second price test of the short-term holder cost base pushing more than 50 per cent of the recent buyers back to the profit zone, the 24-hour simple moving average of the short-term holder's realized profits has soared to over $4.4 million per hour。
Putting this reading in particular in the context of the year: each and every surge of $1.5 million over an hour this year so far overlaps with the local top, making the current reading almost three times the historical warning threshold。
In the absence of a meaningful demand catalyst to absorb this profit-making wave and maintain the momentum above $80 million, a return from the current level would be fully consistent with the model outlined in the present report. Integrated signals point to caution rather than certainty。
Underlink Insight
ETF FINANCIAL FLOWS ARE BACK POSITIVE AGAIN
THE U.S. SPOT ETF FINANCIAL FLOWS HAVE BEGUN TO RECOVER, AND THE MOVING AVERAGE LINE HAS RETURNED TO THE POSITIVE ZONE AFTER LONG PERIODS OF CONTINUOUS OUTFLOWS. THIS MARKED A SIGNIFICANT CHANGE IN INSTITUTIONAL NEEDS, FOLLOWING LARGE OUTFLOWS IN LATE JANUARY AND FEBRUARY。
Recent inflows of clusters indicate a reconfiguration of traditional investors, which coincides with the timing of Bitcoin rebounding from a low point of approximately $65,000 to a medium point of $70,000. While the scale of inflows is still below its peak at the end of 2025, the shift in direction is significant and indicates a return to institutional appetite。
FROM A STRUCTURAL POINT OF VIEW, ETF REMAINS A KEY MARGINAL BUYER IN THE MARKET. SUSTAINED POSITIVE FINANCIAL FLOWS WILL PROVIDE A STRONG DEMAND BASE TO HELP ABSORB SALES PRESSURES AND INCREASE PRICE INTENSITY. COHERENCE, HOWEVER, WILL BE CRITICAL, AS PREVIOUS REBOUNDS ARE DIFFICULT TO SUSTAIN WHEN ETF NEEDS RECEDE。
Return of spot demand
The spot CVD favoured recent trading days with a marked shift towards buyer-dominated transactions, with a marked increase in the cumulative volume of traffic on major exchanges. This indicates that recent price increases are supported by real demand for goods rather than purely derivative-driven flows。
The dynamics at the level of the exchange point to some fragmentation on the surface. Cash-in-money CVD dominates recent buying pressures, while Coinbase's activities are relatively low, pointing to stronger participation in offshore or retail-driven flows. However, the overall CVD trend across all exchanges has turned positive, reinforcing the perception that buyers are entering with conviction。
Importantly, this recovery in spot demand coincided with high prices, indicating that market structures were more constructive than previous rebounds that lacked bottom-up support. This shift in spot positioning, if sustained, may provide a more durable basis for further progress, especially in the context of the growing empty bias in derivative markets。
Empty warehouse, fund rate maintained negative
over the last few weeks, the rate of funds under the contract has moved downwards decisively, and negative inter-zone printing has continued on major exchanges. this marks a clear shift from the positive regime in november and december, when multiple positions prevailed and traders were willing to pay a premium to maintain their exposure。
The current structure reflects an increasing market bias towards empty positions, with participants taking defensive positions after a significant fall in early February. It is worth noting that the continuing negative funding rates for the months of March to April indicate that this is not a brief emotional shift, but rather a more deep-seated vision of air-traffic and speculative leeway。
From a positional point of view, this creates a constructive background. Overcrowded empty positions can be used as up-to-date fuel, especially if spot demand re-emerges or macro conditions stabilize. However, in the absence of strong directional flows, this imbalance may reflect a continued cautious market。
Implicit volatility continues down
Starting with an implied rate of volatility, the dominant trend for the duration of the curve remains downward. The duration of 1 month, 3 months and 6 months has continued downwards over the past two weeks, reflecting the expected steady contraction of fluctuations。
1 The weekly deadline has been more intense, with several sharp increases to 46 per cent, but these trends have not been sustained and have quickly returned to a wider downward trend. This demonstrates the reluctance of the market to maintain short-term protection buyouts. On the contrary, volatility has been continuously sold over various periods。
Even with higher prices, implied volatility has not expanded, pointing to a lack of urgency and limited upward recovery. The overall structure remained soft and there was no clear sign of a wider shift in volatility, except for continued surface pressure on the seller。
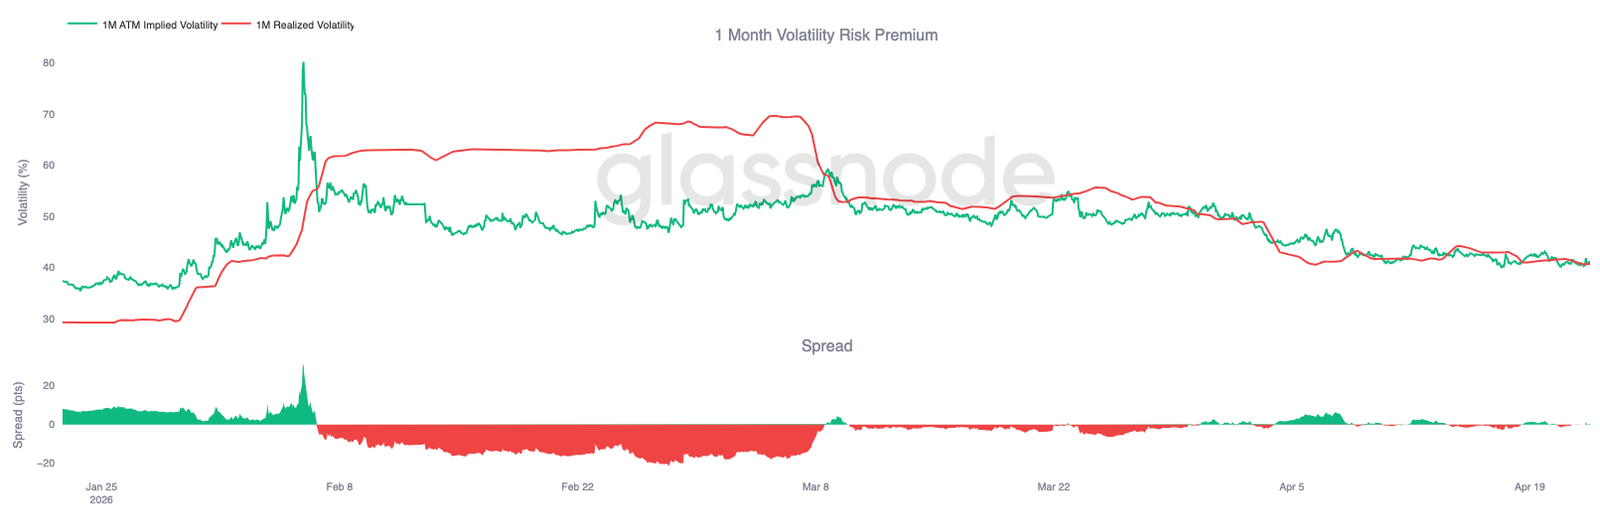
Proof compression of volatility achieved
As implied volatility continues to sell, the realized volatility also moves in the same direction and reinforces the trend。
Bitcoin has achieved 30 days of volatility, which is currently at 40.7 per cent, down from 49 per cent at the beginning of April, and price movements have remained low and follow-up has been limited. This is important because the volatility anchor has been achieved to determine how options should be priced. When the realized volatility remains low, it is difficult to maintain any upward movement since there is no pressure at the bottom to justify higher premiums。
This is clearly reflected in the risk premium for the volatility rate, which is now close to zero, meaning that the implied volatility rate no longer represents any meaningful premium for the realized volatility rate. The option is being priced according to what has happened rather than what may happen。
The combination of low realized volatility and continued volatility has kept the overall environment soft and has not pressured the volatility to repricing higher pressures。
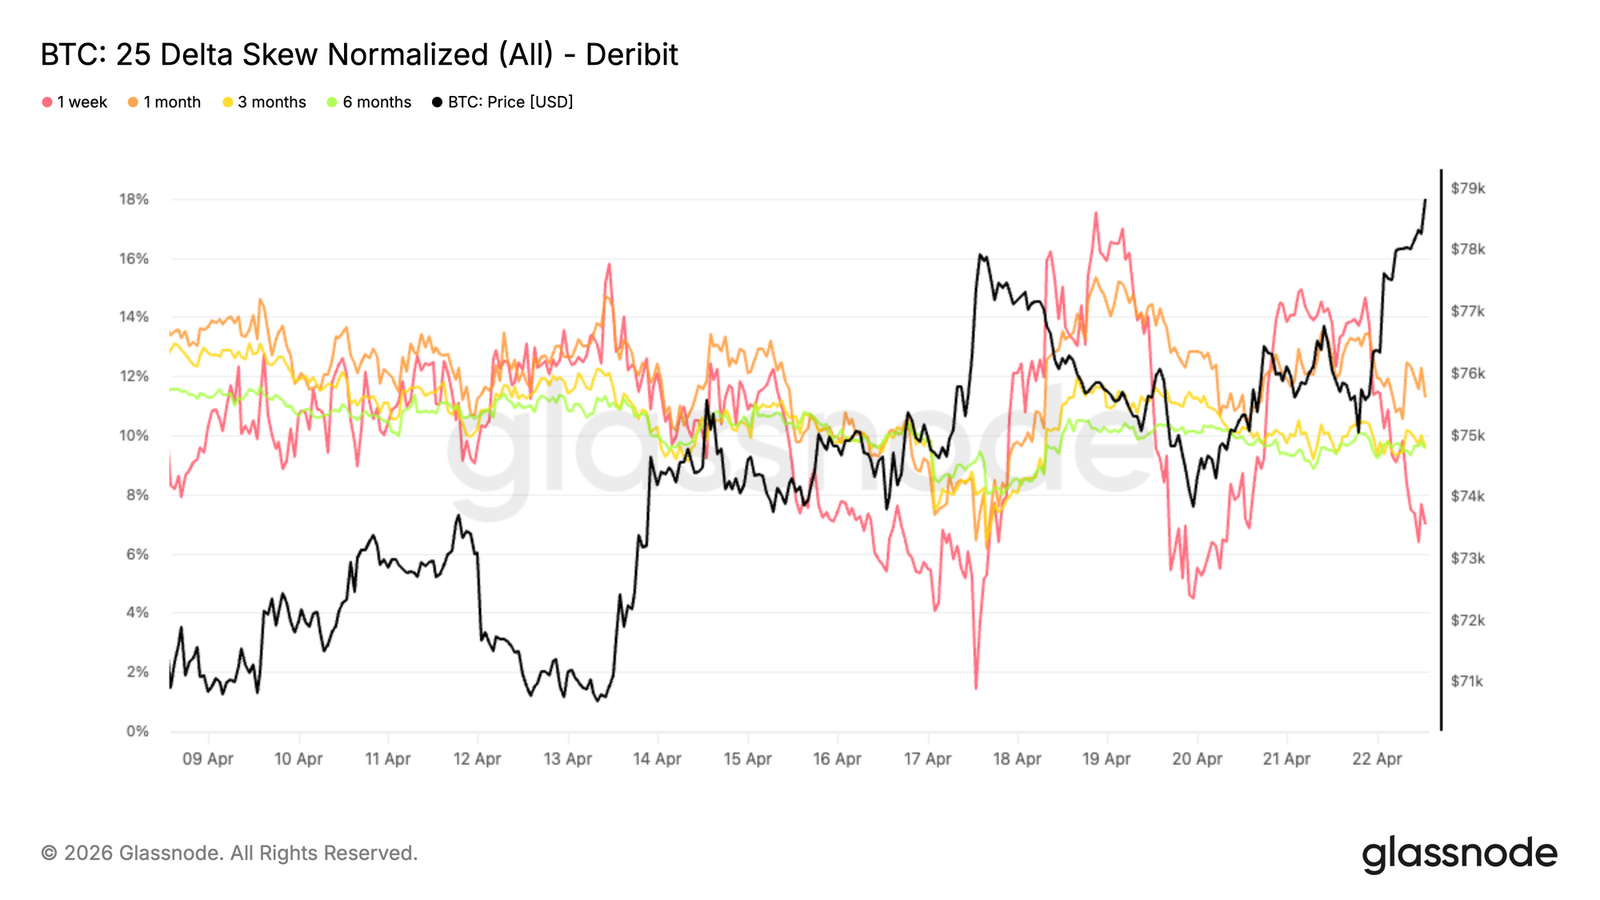
Short-term bias fluctuations and broader structural maintenance
the bias adds more nuances to the picture. 25 delta dichotomy (see the drop in options) fluctuates sharply at the front end of the week, with a week-by-week premium falling at 2 per cent and a weekend rebounding at over 7 per cent。
This rapid return highlighted the responsiveness of short-term positioning. By contrast, the duration of one month, three months and six months has remained relatively stable over the past two weeks, in the vicinity of 10 to 12 per cent, and continues to reflect a firm buyout of downside protection. This fragmentation suggests that the volatility is driven by short-term positioning rather than broader emotional shifts。
The temporary decline points to a brief release of short-term hedges, but a rapid rebound indicates that protection needs have not disappeared. The market is making tactical adjustments at the front end while maintaining a cautious position at the far end of the curve。
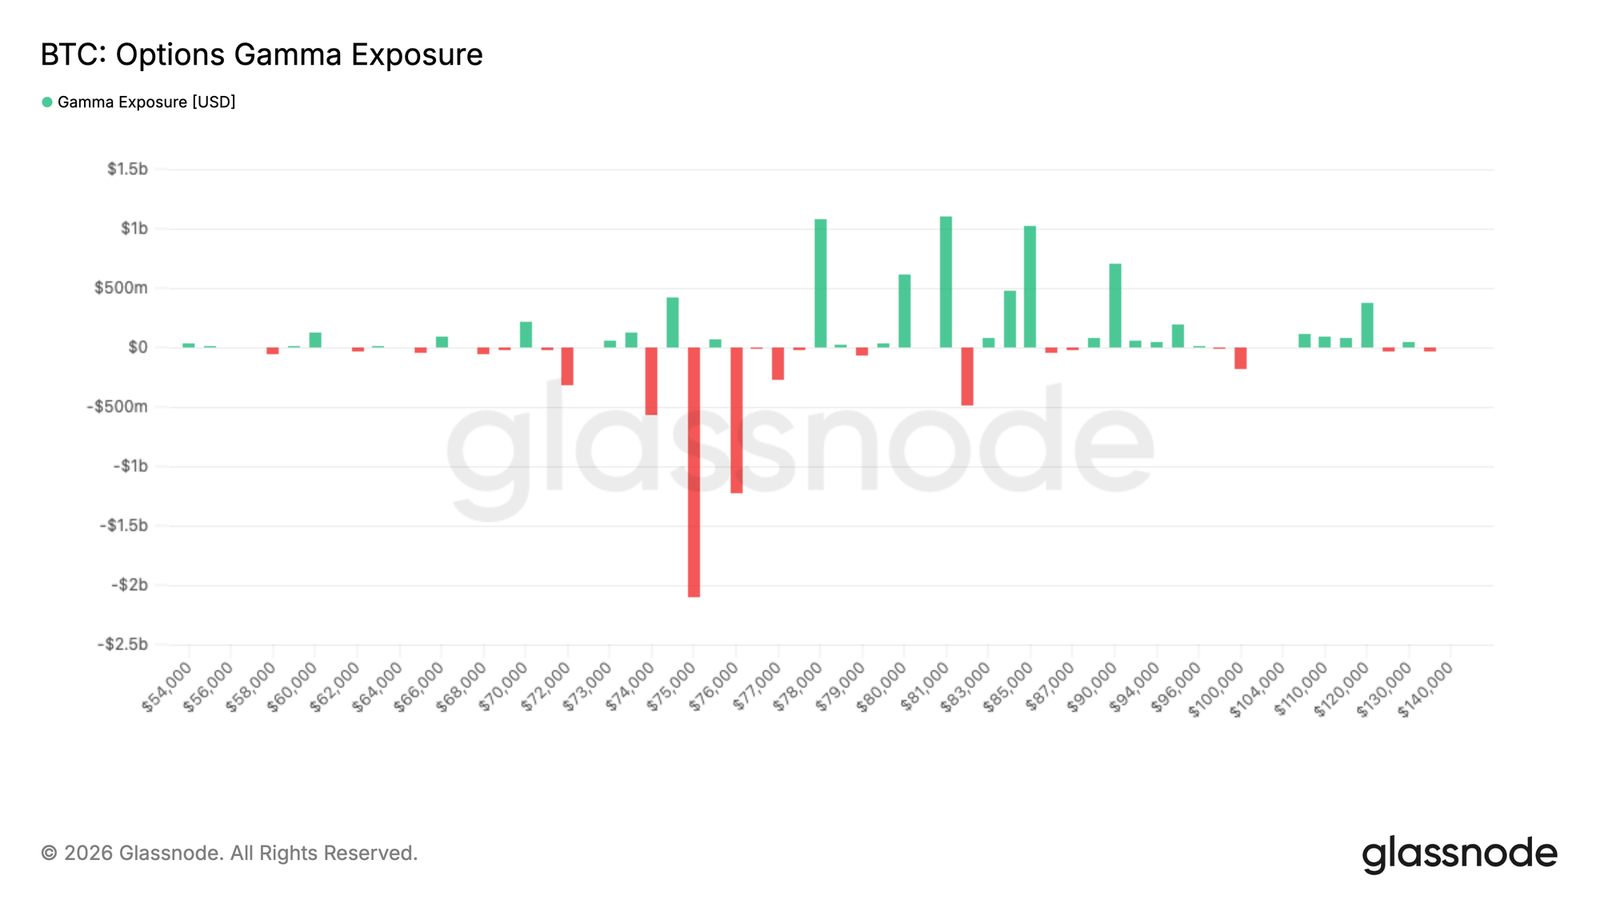
Gamma position to outline short-term resistance and downside risks
When observing Gamma as a marketer, the silo map became clearer. There is a significant negative concentration of Gamma below current prices, particularly in the $75,000 region, which has the most extreme level of exposure。
Bitcoin is currently traded in the vicinity of $79,000, with prices above the region, while the immediate line goes into the positive Gamma region. Within this zone, the movement of hedges tends to discourage upward movement and to create mechanical resistance, as market chambers sell in a strong position. However, the risk is below. If the price goes back to the middle of $75,000, it will enter the negative Gamma region and the hedge of the marketer may accelerate down-price action。
Recent financial flows add important nuances. Over the past seven days, increased options buy-in has dominated activities, pointing to the market as the top point. In the past 24 hours, however, as cash approached $80,000, the flow of funds turned to the sale of increased options, indicating that the top line was being honoured rather than pursued。
Conclusions
THE RETURN OF BITCOIN TO REAL MARKET AVERAGES MARKED AN IMPORTANT SHIFT IN MARKET STRUCTURE, WITH PRICES RECOVERING A CRITICAL COST BASE THAT OFTEN DEFINED BEAR MARKETS AND CONSTRUCTIVE BORDERS. THIS RECOVERY IS CURRENTLY SUPPORTED BY IMPROVED SPOT DEMAND AND AN INITIAL RETURN OF ETF INFLOWS, INDICATING THAT RETAIL AND INSTITUTIONAL PARTICIPATION IS BEGINNING TO RE-ENGAGE。
At the same time, derivative silos present a more cautious picture. The continued negative funding rate highlights the growing empty bias, which could become an upward fuel if demand continues to grow. However, the realization of high profits and the lack of a volatile premium suggest that conviction remains fragile and traders continue to hesitate to actively position themselves for continuity。
TAKEN TOGETHER, MARKETS SEEM TO BE MOVING TOWARDS A MORE CONSTRUCTIVE PHASE, BUT STILL NEED TO BE RECOGNIZED. CONTINUED BREAKTHROUGHS OF $80,000 ARE LIKELY TO DEPEND ON THE CONTINUATION OF SPOT ABSORPTION AND THE STABILIZATION OF ETF REQUIREMENTS, WHILE FAILURE TO MAINTAIN CURRENT LEVELS MAY LEAD TO A DOWNWARD ACCELERATION DUE TO A RELATIVELY THIN LIQUIDITY ENVIRONMENT。
