
2026 Q1 STUDY ON MARKET SHARE OF ENCRYPTED CURRENCY

summary and core findings & nbsp;
IN THE FIRST QUARTER OF 2026, THE ENCRYPTED CURRENCY MARKET AS A WHOLE REMAINED RELATIVELY ACTIVE, BUT THE SIZE OF THE TRANSACTION FELL GRADUALLY FROM A HIGH LEVEL IN JANUARY. BASED ON Q1, THE MARKET-WIDE PORTFOLIO IS ABOUT US$ 1.94 TRILLION, THE DERIVATIVES ABOUT US$ 18.63 TRILLION, TOTALLING ABOUT US$ 20.57 TRILLION, AND THE DERIVATIVES ARE ABOUT 9.6 TIMES THE MARKET VALUE. STRUCTURALLY, MARKET DYNAMISM REMAINS LARGELY CONCENTRATED IN DERIVATIVES MARKETS, WITH A RELATIVELY LARGER CONTRACTION IN SPOT DELIVERY。
On the core indicators, Binance continues to maintain industry leadership. The volume of derivatives traded was about $4.90 trillion, with a corresponding share of about 34.9 per cent under the Top 10 exchange calibre; an average daily hold of about $23.9 billion, with a corresponding share of about 29.9 per cent; and the deposit of user assets of about $15.29 billion, with a share of about 73.5 per cent under the main CEX calibre. By comparison with the second name, Binance's derivatives trade is about 2.2 times greater than OKX, the average OI is about 2.2 times greater than Bybit and the size of user assets is about 9.6 times larger than OKX. The data reflect that the lead of Binance is not concentrated on a single dimension, but is reflected at the same time in four dimensions: transaction, warehousing, liquidity and retention。
From Top 5 competition patterns, the market has developed a clearer hierarchy. In the derivatives trade dimension, Binance, OKX, Bybit, Gate, Bitget rank fifth, of which Bybit is close to Gate, OKX remains the closest central platform to Binance; in the silo dimension, the second ladder is sequenced to Bybit, Gate, OKX, Bitget. In the sedimentary dimension of the user asset, Binance, only OKX remained at over $10 billion, and Gate, Bitget and Bybit were in the range of $5 billion to $7 billion. Overall, Top 5 has more internal competition, but there is still a significant gap between the lead platform and the follow-on team。
II. Factual and derivatives trade volumes
2.1 market-wide overview of monthly transactions & nbsp;
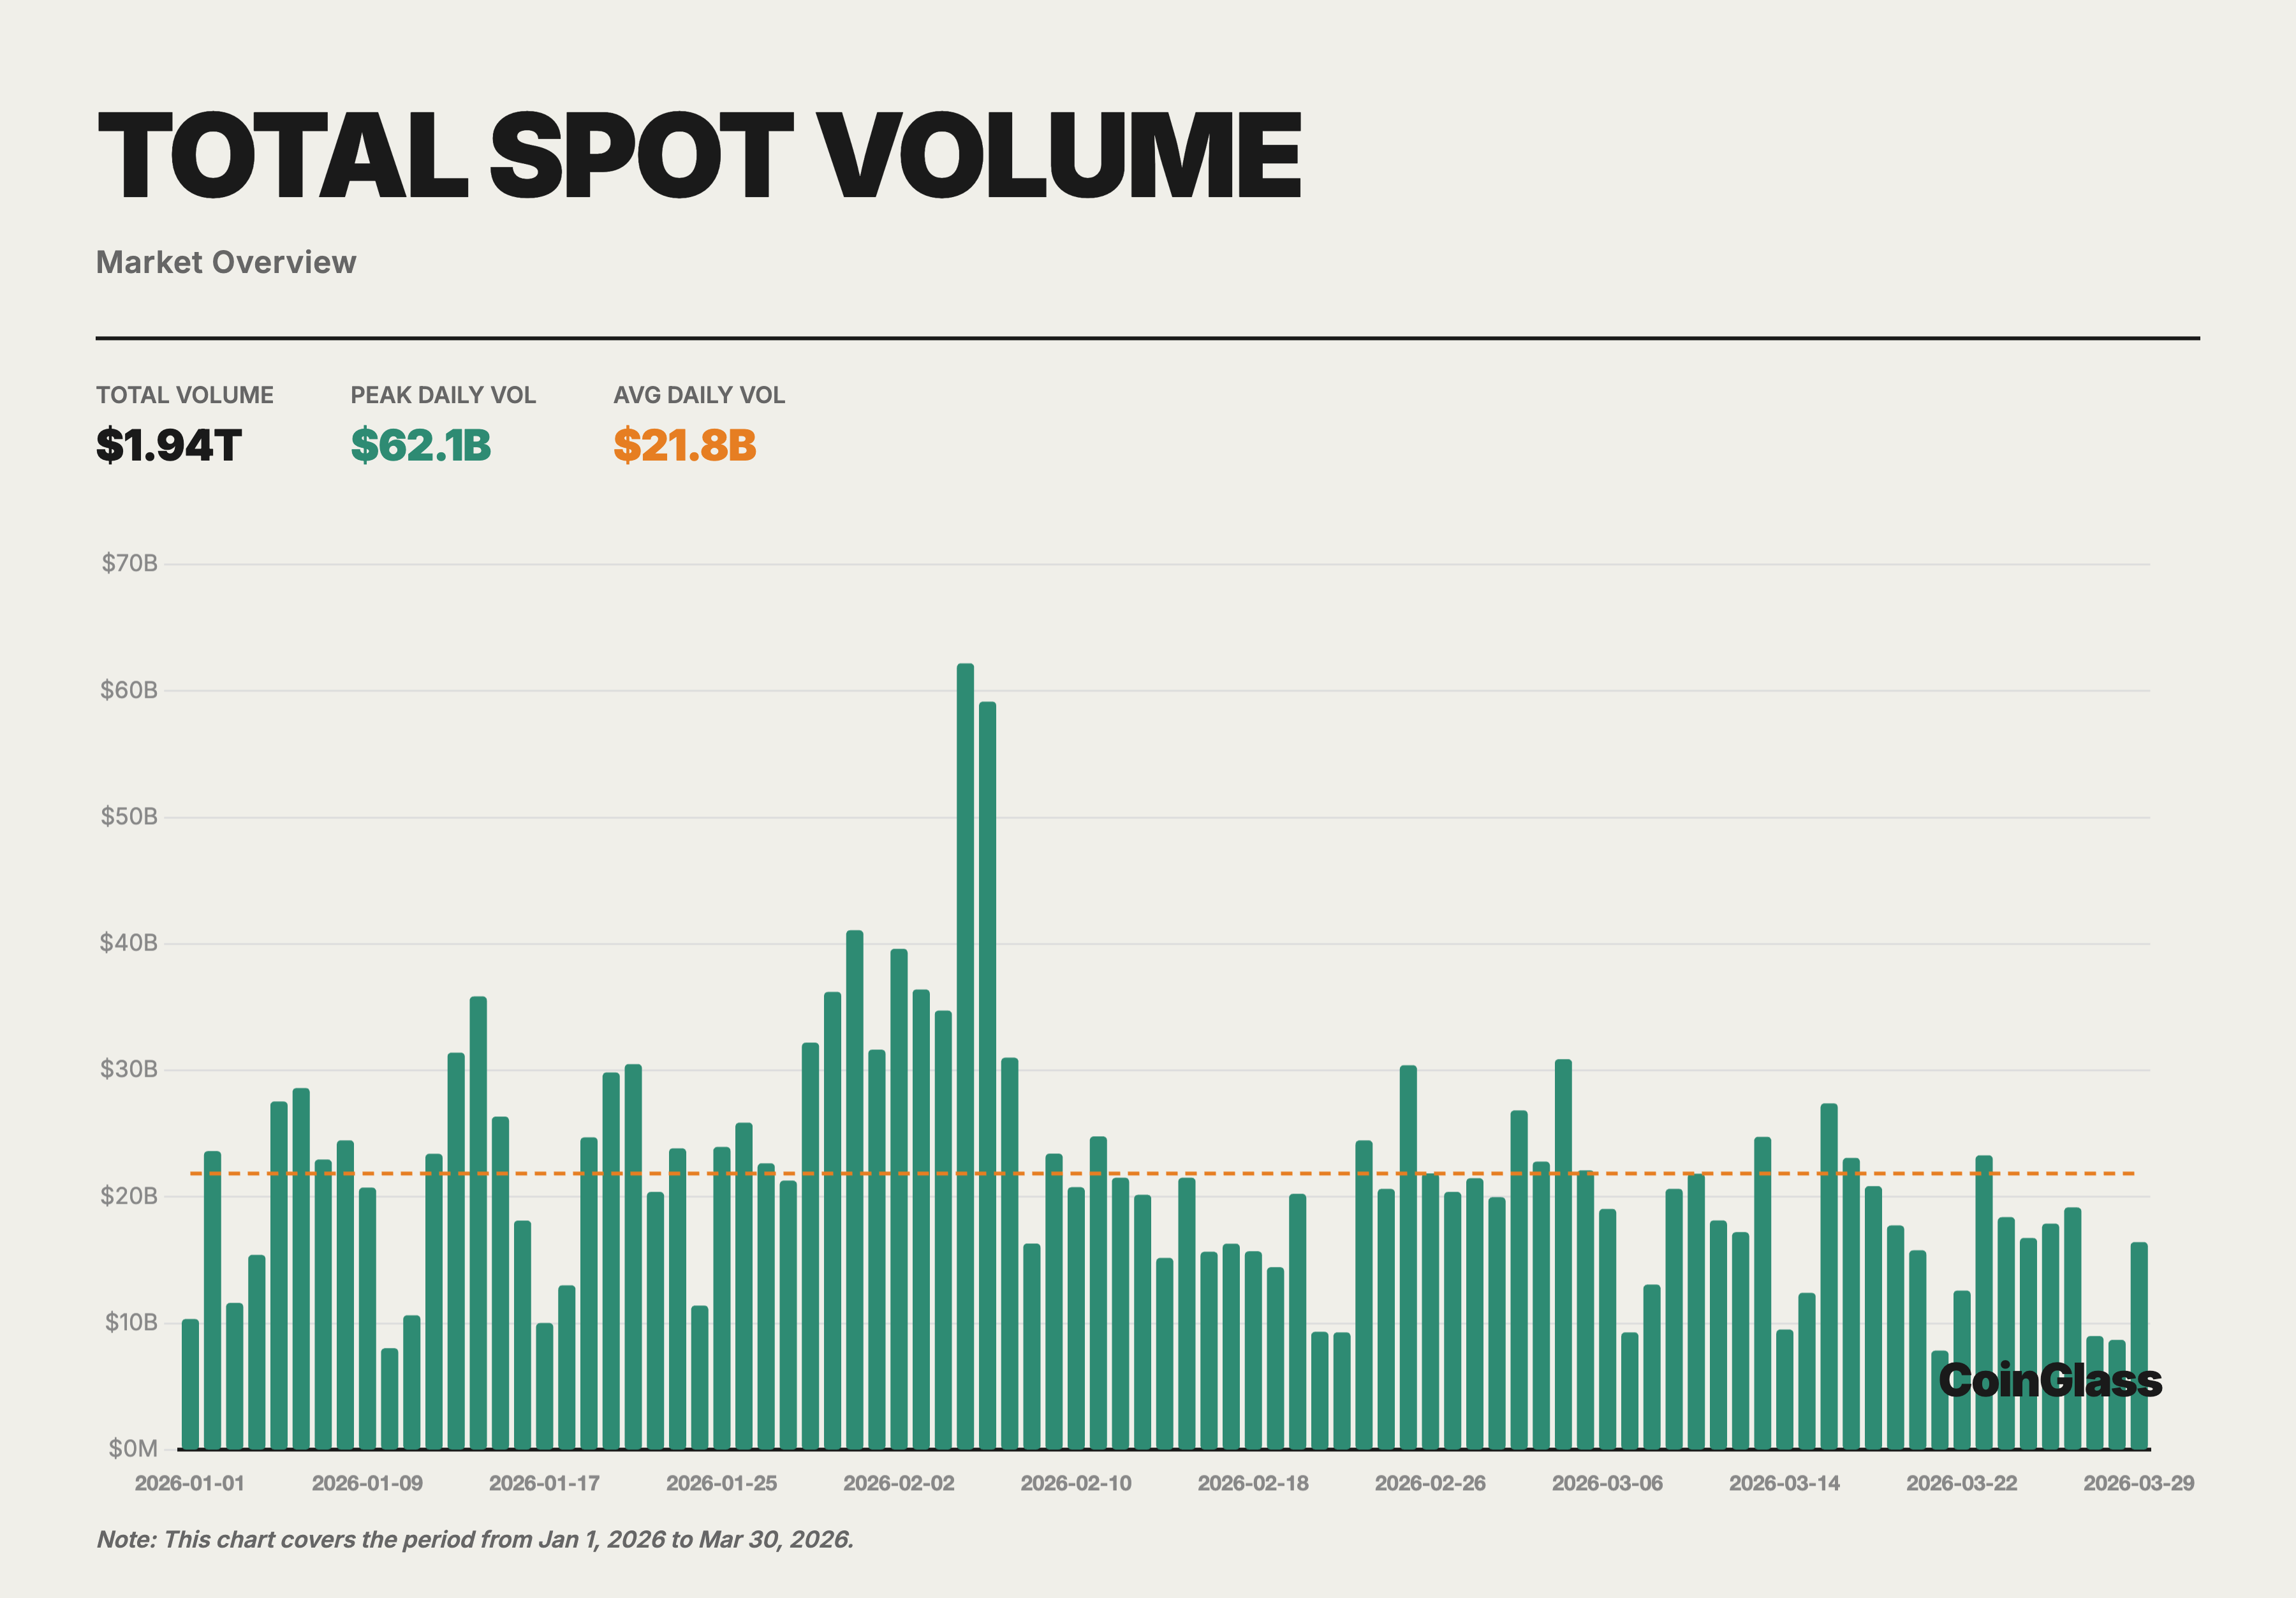
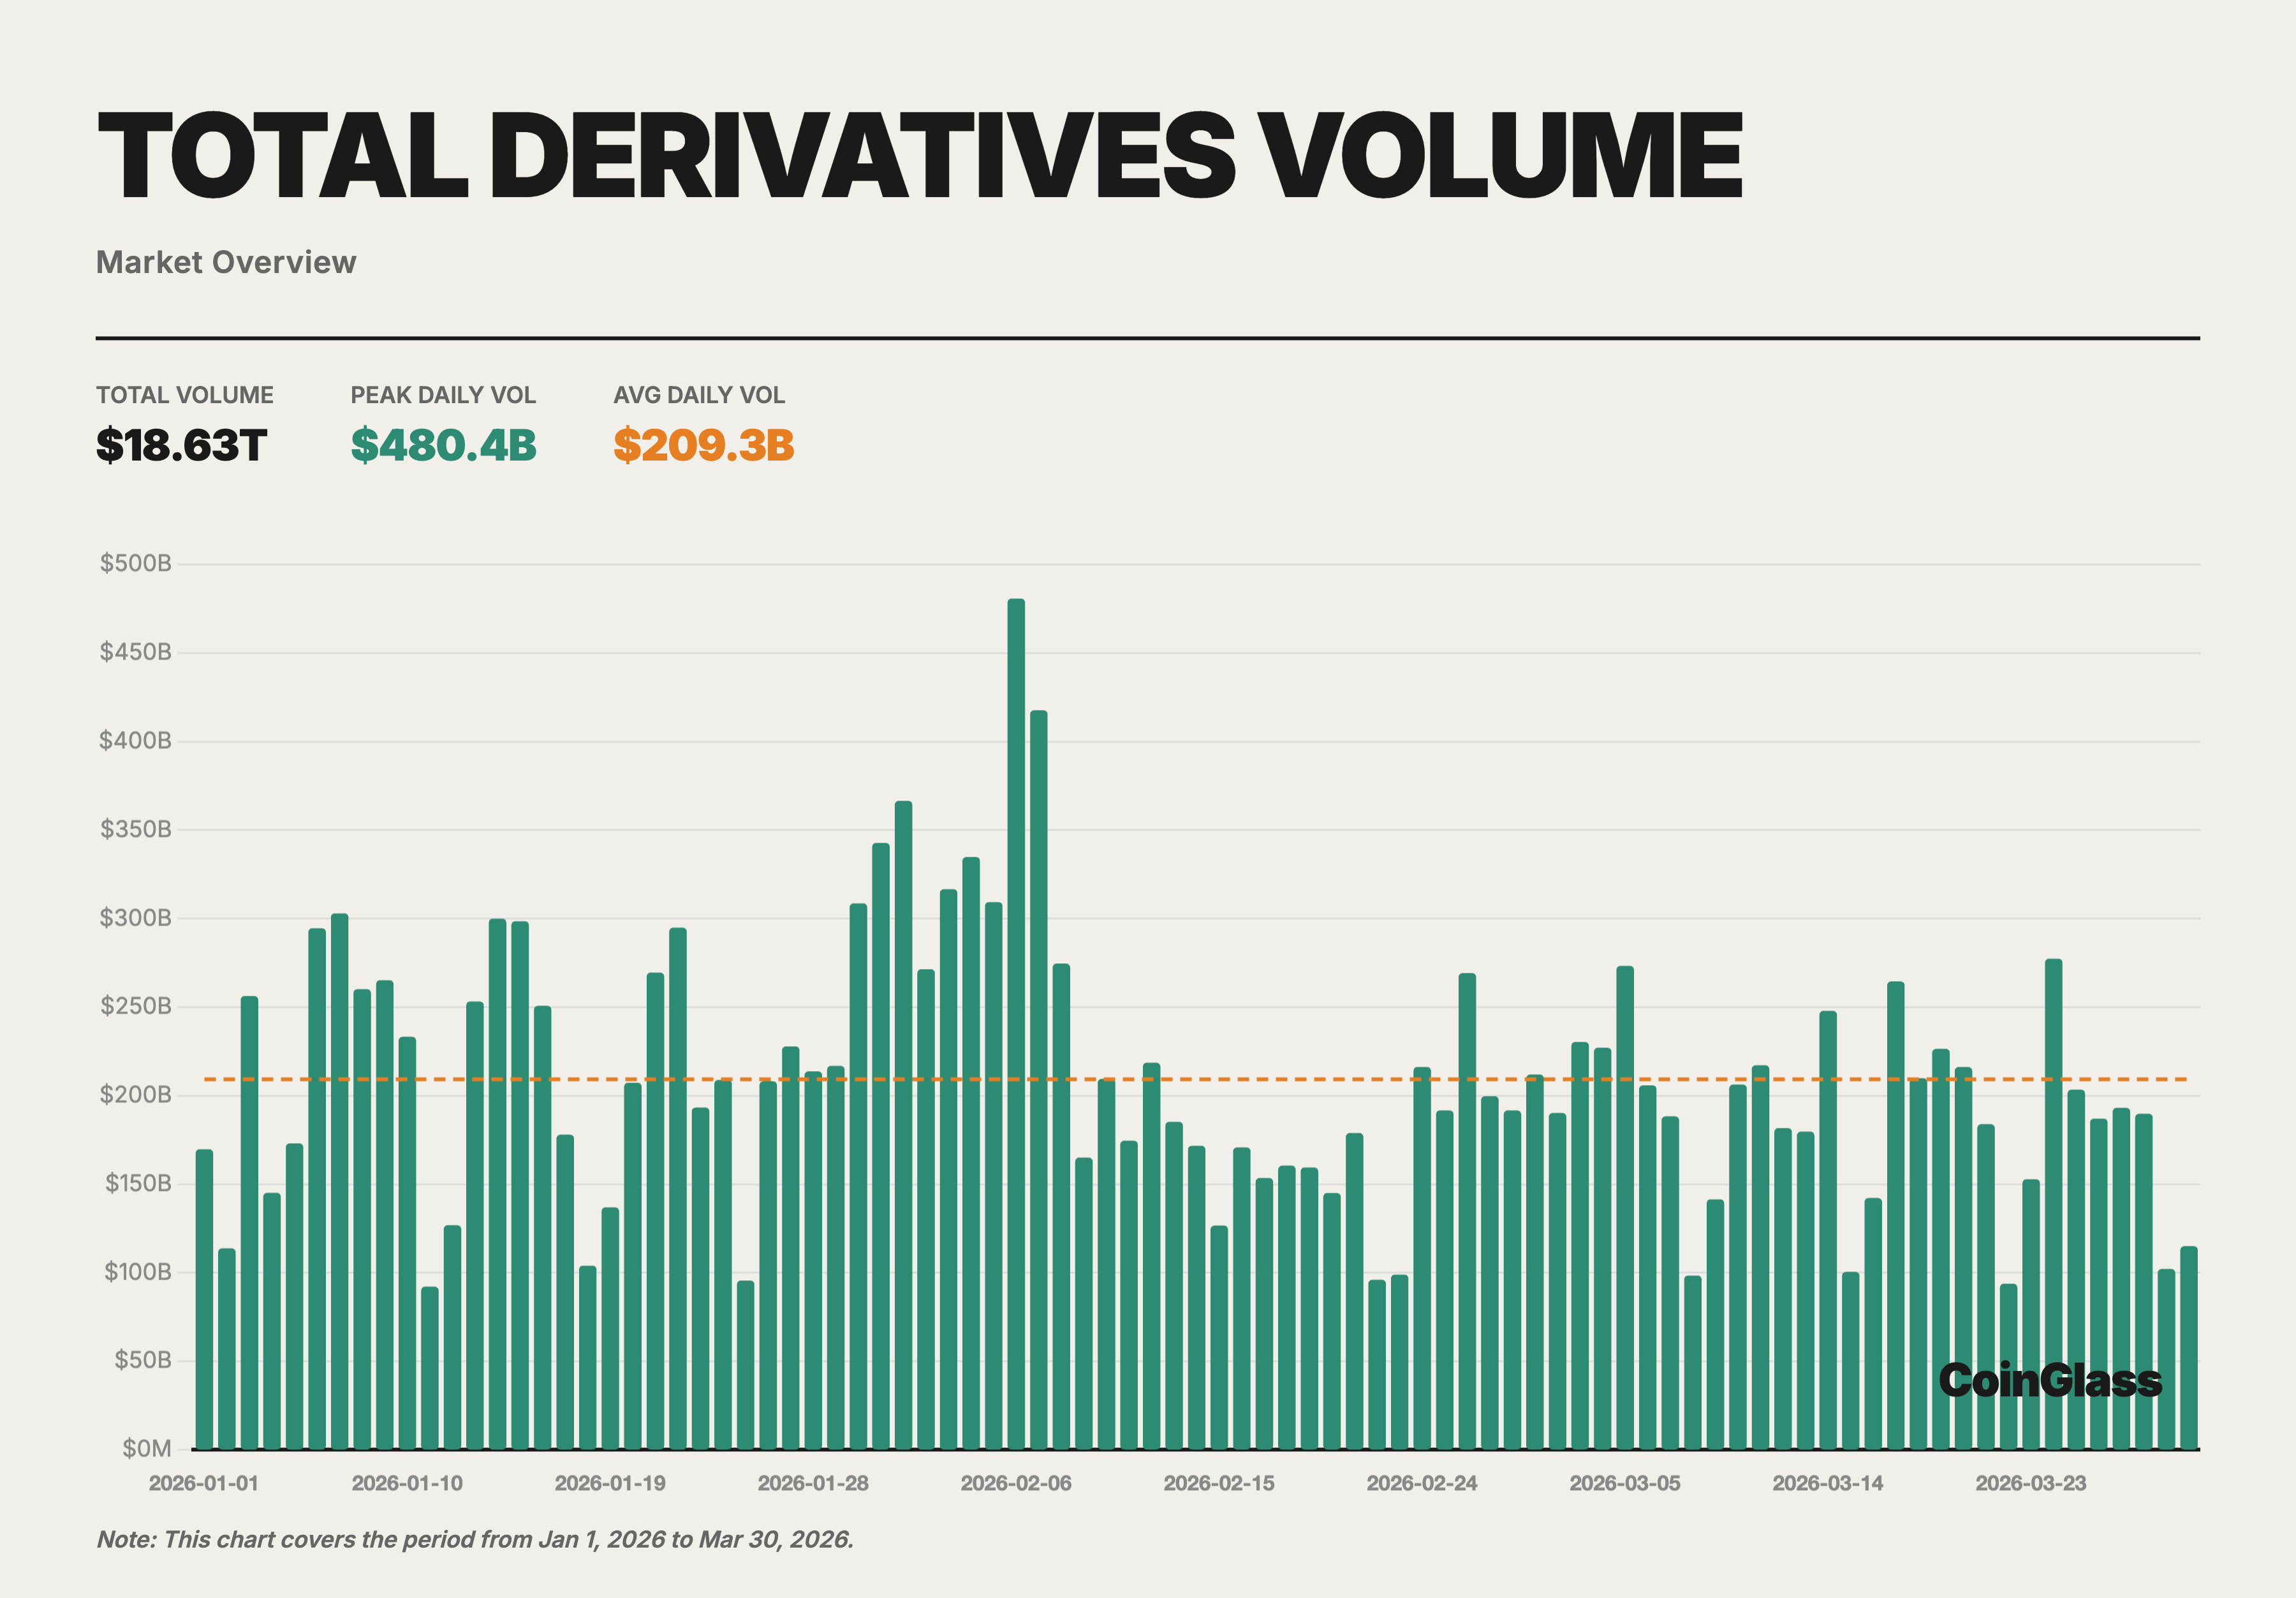
IN 2026 Q1, THE MARKET-WIDE TOTAL OF ENCRYPTED CURRENCY TRANSACTIONS ( SPOT + DERIVATIVES) WAS APPROXIMATELY $20.57 TRILLION, OF WHICH SPOT TRANSACTIONS WERE APPROXIMATELY $1,94 TRILLION AND DERIVATIVES TRANSACTIONS ABOUT $18.63 TRILLION. IN TERMS OF MONTHLY DISTRIBUTION, JANUARY HAD THE HIGHEST TOTAL VOLUME OF TRANSACTIONS (70.47 BILLION IN CASH + 6.73 TRILLION IN DERIVATIVES), FEBRUARY HAD FALLEN SLIGHTLY, AND MARCH HAD FURTHER CONTRACTED TO A QUARTERLY LOW. THIS TREND ECHOES THE CAUTIOUS SENTIMENT OF THE GLOBAL MACRO-ENVIRONMENT DURING THE SAME PERIOD, WHEN THE MARKET HAS YET TO FULLY RECOVER ITS RISK PREFERENCES AFTER HAVING UNDERGONE A SHARP DELEVERAGING OF Q4 IN 2025。
THE SPOT MARKET IS ABOUT $21.8 BILLION A DAY AND THE DERIVATIVES MARKET ABOUT $20.9 BILLION A DAY. THE RATIO OF DERIVATIVES TO CURRENTS REMAINED STABLE AT Q1 ABOUT 9.6 TIMES, SLIGHTLY ABOVE THE AVERAGE FOR THE WHOLE OF 2025. THIS SUGGESTS THAT, AT THE MARKET ADJUSTMENT STAGE, TRADERS TEND TO HEDGE AGAINST SHORT-TERM GAMING THROUGH DERIVATIVES RATHER THAN DIRECTIONAL CONFIGURATION IN SPOT MARKETS。
2.2 spot transactions and market share
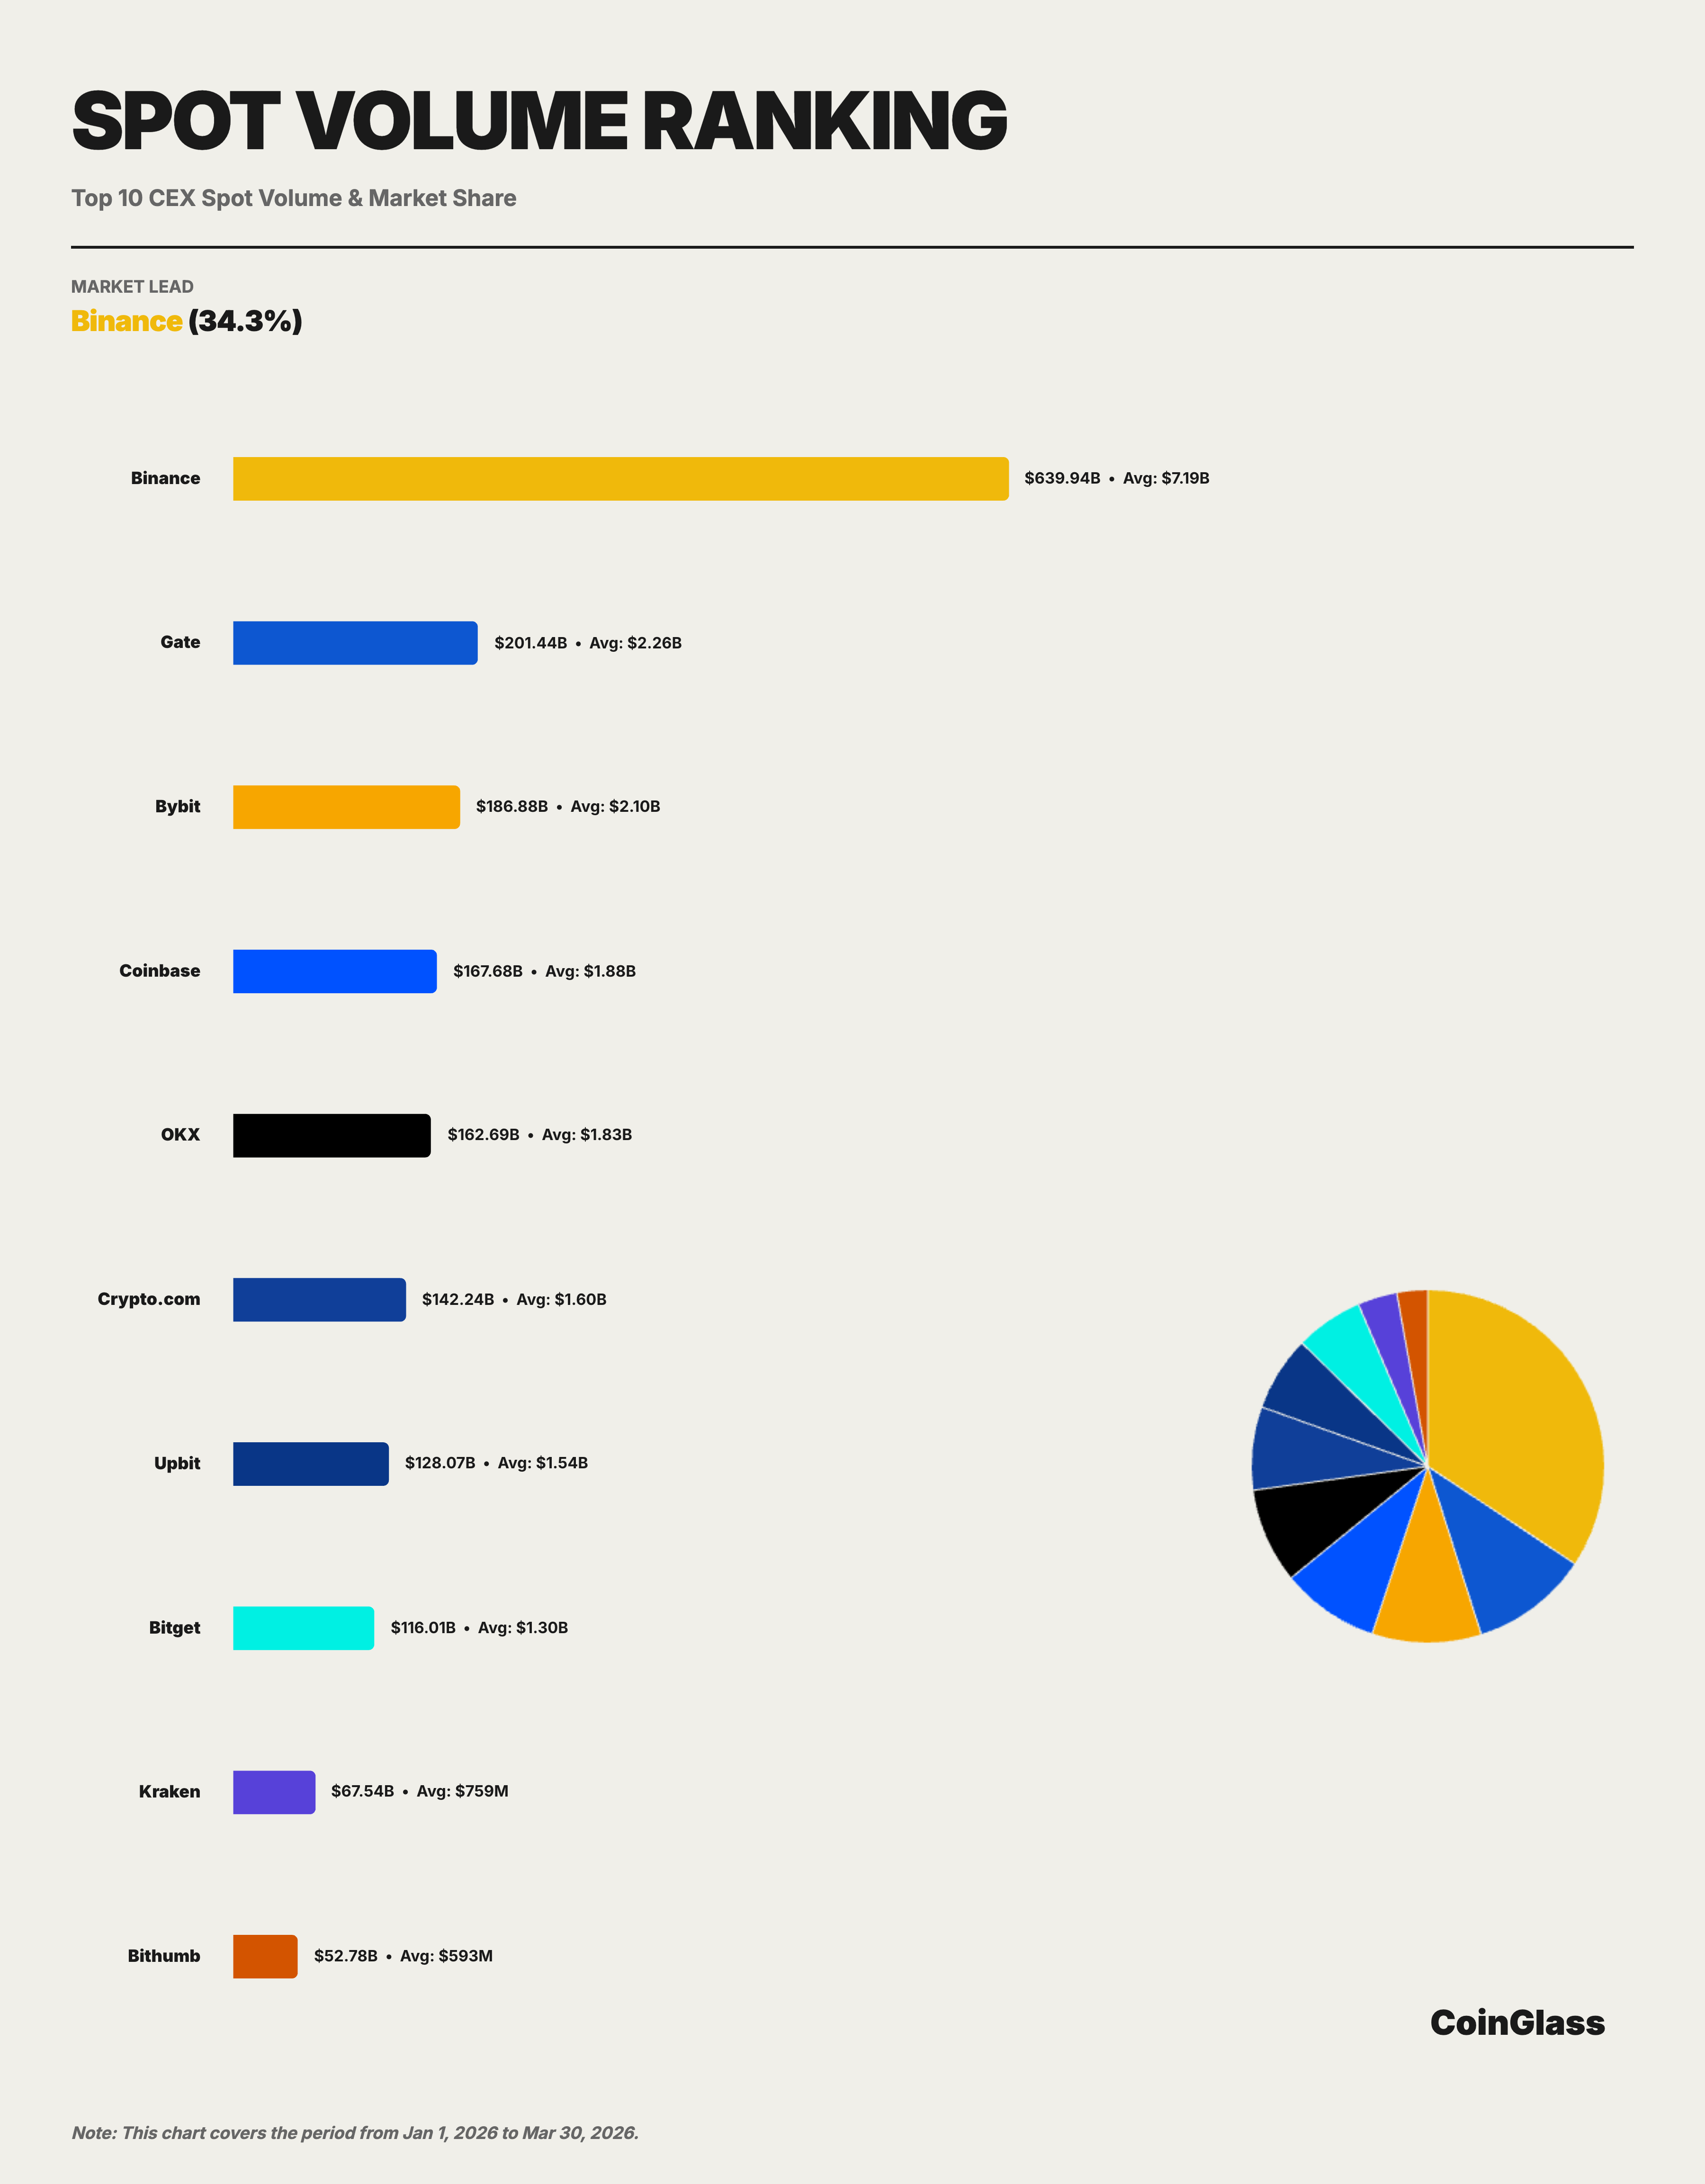
Binance accumulated approximately $63.9 billion in the Q1 spot market, corresponding to an average of $7.19 billion per day and a market share of about 34.3 per cent under Top10. In terms of monthly trends, the share of Binance in the spot Top 10 exchange remained stable as a whole: 34.0 per cent in January 2026, 33.7 per cent in February and 35.4 per cent in March. Although the market pool contracted from $70.4 billion in January to $54.2 billion in March, representing a 23 per cent decline, Binance ' s share rose slightly. This indicates that, despite the overall fall in the spot market, head liquidity continues to concentrate on a few platforms。
If competition patterns are extended to Top 5, spot markets are clearly more dispersed than derivative markets. Q1 The five platforms in the top five cumulative spot deal rankings are Binance, Gate, Bybit, Coinbase and OKX, corresponding to approximately 63.9 billion, 2014 billion, 18.6 billion, 16.7 billion and $16.27 billion. The shares of the remaining four platforms, except Binance, are roughly between 8 and 10 per cent by market-wide calibre. That is to say, Binance's lead in the spot market is clear, but the second tier of the spot market is more evenly distributed and competitively dispersed than the derivative market。
2.3 Derivatives trade and market share
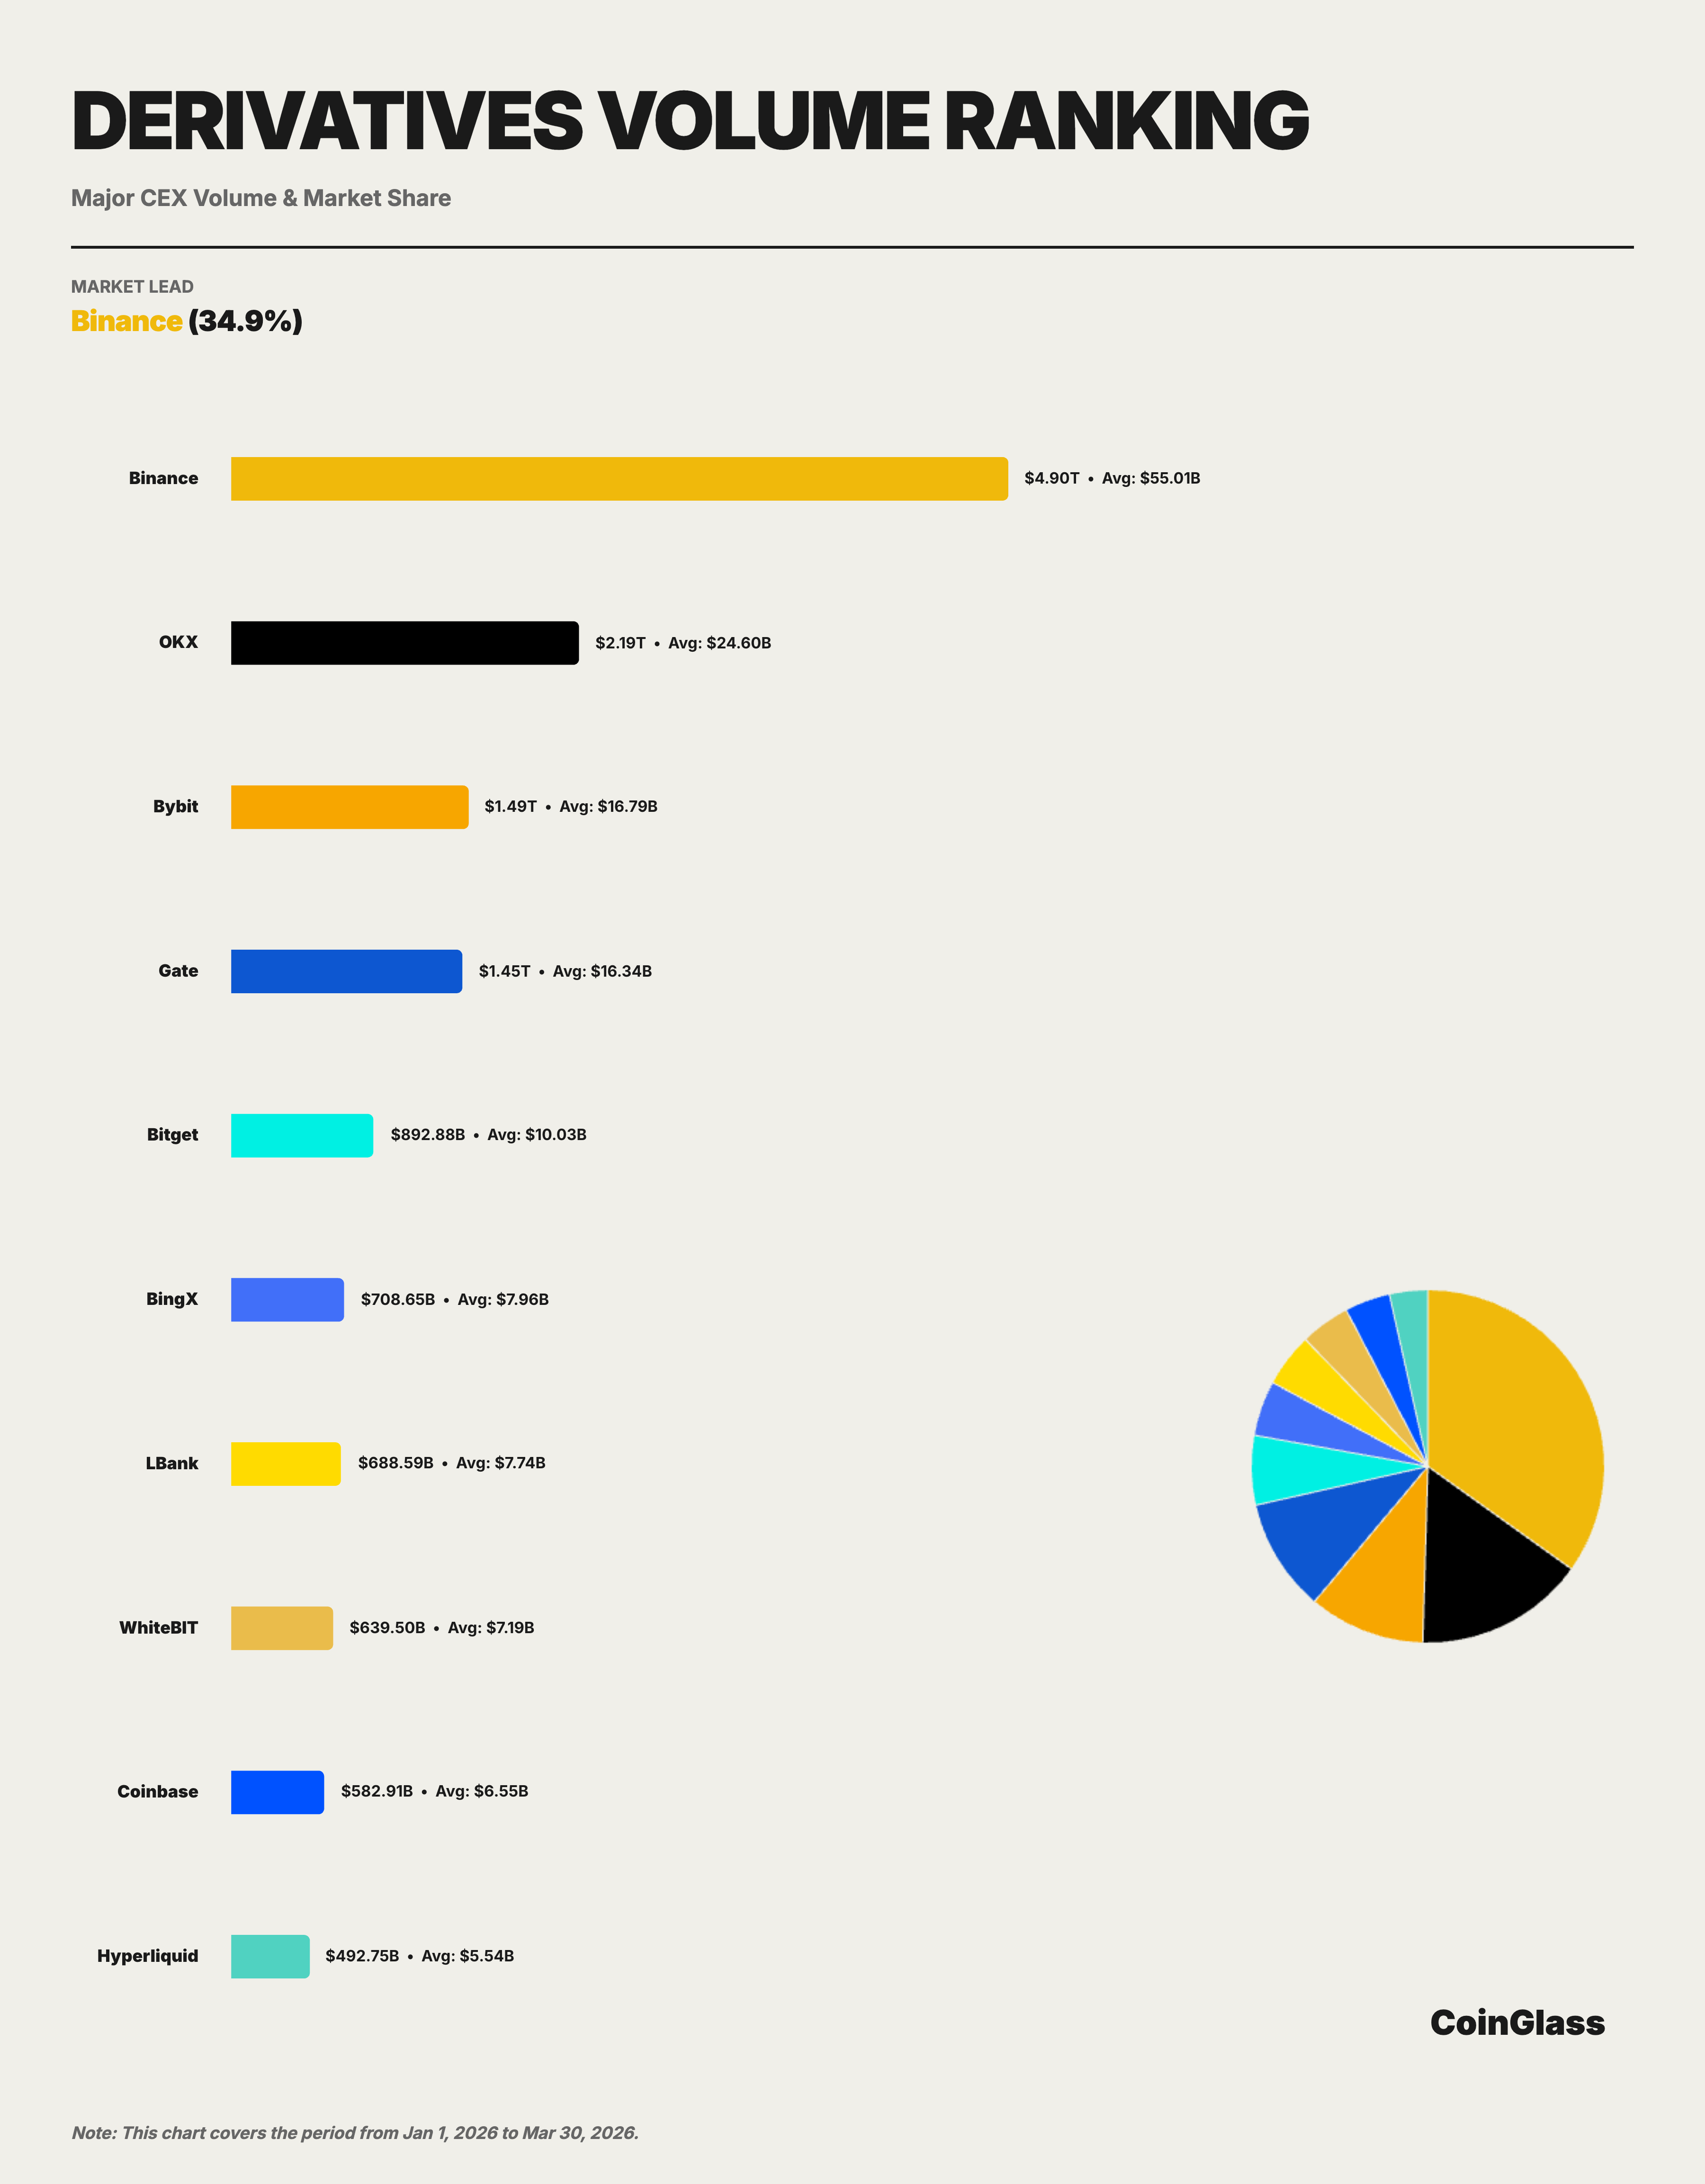
Binance cumulatively concluded contracts in the Q1 derivatives market of $490 trillion, with a daily average of about $55 billion. At Top 10, Binance had a steady 34.9 per cent share, with transactions exceeding the sum of the second OKX ($219 trillion) and the third Bybit ($1.49 trillion)。
In terms of monthly trends, the trade share of Binance in the derivative Top 10 exchange was generally strong: 33.2 per cent in January 2026, 35.8 per cent in February and 35.7 per cent in March. This downward trajectory is consistent with the process of returning market liquidity to the head platform after the deleveraging in the fourth quarter of 2025. In other words, at the beginning of the quarter, the volume of inter-platform transactions was temporarily dispersed, but as the market stabilized, liquidity continued to flow back to more deep and efficient platforms, Binance demonstrated a greater absorptive capacity in the round。
OKX is currently the closest centralised platform to Binance, but it still has only about 45% of Binance; Bybit is close to Gate and forms the middle of the second stage; Bitget, though stable in the top five, has a more visible fault with the first four. By relative measure, Binance's derivatives are traded about 3.3 times more than Bybit, 3.4 times more than Gate and 5.5 times more than Bitget。
2.4 Comparison of competition patterns
When spot and derivatives are seen in the same framework, a marked difference can be observed in the pattern of competition between the two markets. In the spot market, Binance maintains the first, but the second is made up of a relatively close share of Gate, Bybit, Coinbase and OKX; in the derivatives market, Binance leads more, and there is a hierarchy between second and third and fourth. As a result, Binance has become more central in the derivatives market, while the spot market has a “head first and second ladder” structure。
From platform positioning, OKX is the second most stable in terms of the size of derivatives traded, and the closest challenge to Binance; Bybit and Gate have a much closer level of competition, with greater participation among active global traders, while the latter maintain a high level of presence in terms of turnover and silo dimensions. BingX, LBank, WhiteBIT, Coinbase and Hyperliquid, after Top 5, still maintain significant trading activities, but there is still a gap in overall volume compared to the top five platforms。
It is a matter of concern that the go-to-centre derivative platform has entered the mainstream comparative perspective. Hyperliquid ' s trade in Q1 derivatives is approximately $49.27 billion, which is among the top 10 and reaches an average of approximately $6 billion in silo dimensions. This means that the chain derivatives are no longer merely marginal supplements, but are beginning to compete in local markets. However, on a current scale, its overall volume is still significantly lower than the head-centreized platform of Binance, OKX, Bybit and Gate。
III. Derivative holding
3.1 Trends in total market-wide contract holdings
In 2026, Q1, the market-wide derivative hold (Open Interest) averaged approximately $117.2 billion per day, with quarterly peaks on 15 January, reaching approximately $152.5 billion. From the monthly trend, the average of January OOI was about $141.1 billion, falling sharply to $102.6 billion in February, a decrease of about 27 per cent, and a small recovery to $106 billion in March。
3.2 SHARE AND CHANGE IN RANKING
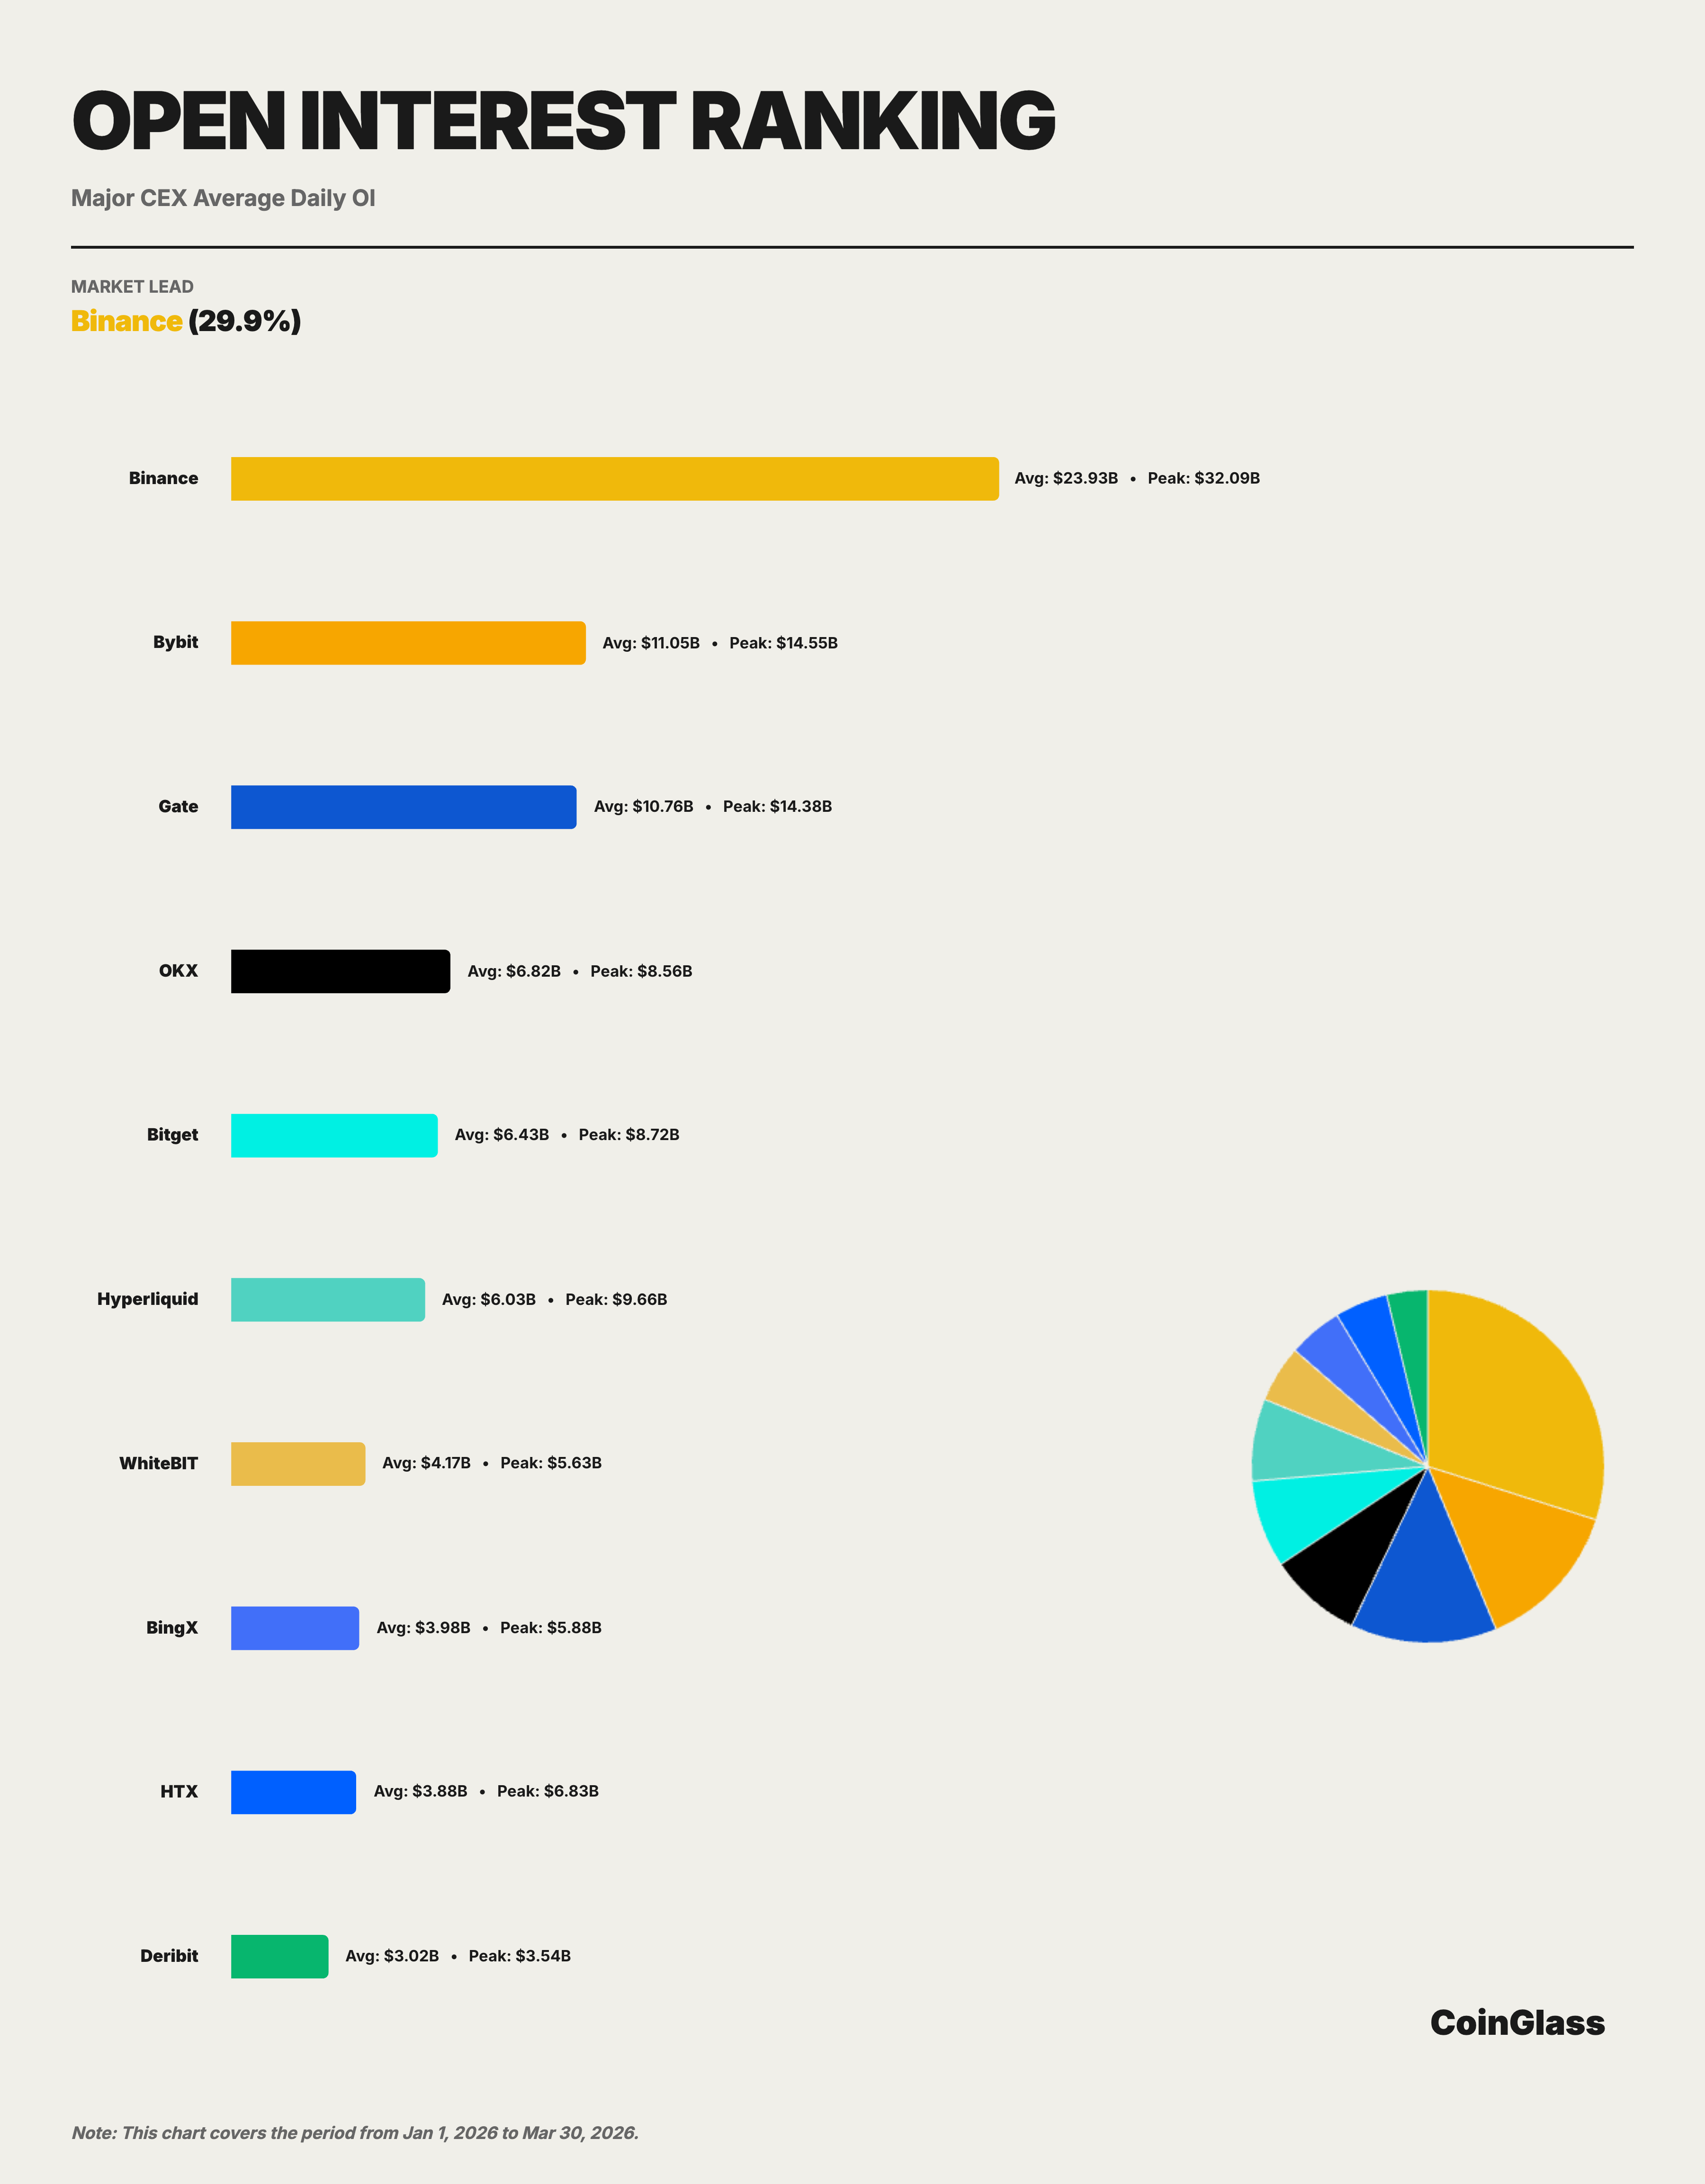
On average, Binance in Q1 is about $23.9 billion, with a corresponding share of approximately 29.9 per cent in Top 10 Exchange, ranked first. The second to fifth places, bybit, Gate, OKX and Bitget respectively, averaged about $11 billion, $10.8 billion, $6.8 billion and $6.4 billion, respectively. The average of Binance ' s OI is about 2.2 times that of Bybit, 2.2 times that of Gate, 3.5 times that of OKX and 3.7 times that of Bitget, with a clear lead。
Binance ' s share of the OI remained at 20-21 per cent (market-wide) over the quarter, with limited volatility, indicating that its position in the silo market was generally stable. More notably, the peak of Binance, about $32.1 billion, is about 2.2 times the second bybit peak ($14.5 billion), demonstrating the ability of Binance to absorb more space in times of increased volatility。
3.3 Market structure analysis
The structure of the warehouse market presents different characteristics from the volume of transactions. In terms of trade dimension, Binance is ahead of the second position by more than 19 percentage points; however, the gap between Binance (29.9 per cent), Bybit (13.8 per cent), Gate (13.4 per cent) and OKX (8.5 per cent) has narrowed in silo dimensions. This reflects the competitive advantage of different platforms in attracting long-term hold。
The size of the warehouse in Hyperliquid deserves special attention. Its daily average is about $6 billion, peaking close to $9.7 billion, approaching Bitget and above platforms such as WhiteBIT and BingX. The increased availability of the platform on the chain is indicative of its increasing attractiveness in high leverage and strategic transactions. In the short term, this trend has not been sufficient to shake the lead on Binance, but for the second tier platform, the entry of chain competitors is increasing the complexity of future share competition. As a chain derivative agreement, the rapid growth in the size of its holding further validates the judgment in the Annual Report 2025 that “decentrochemical derivatives move from conceptual validation to actual market share competition”。
IV. Depth of liquidity
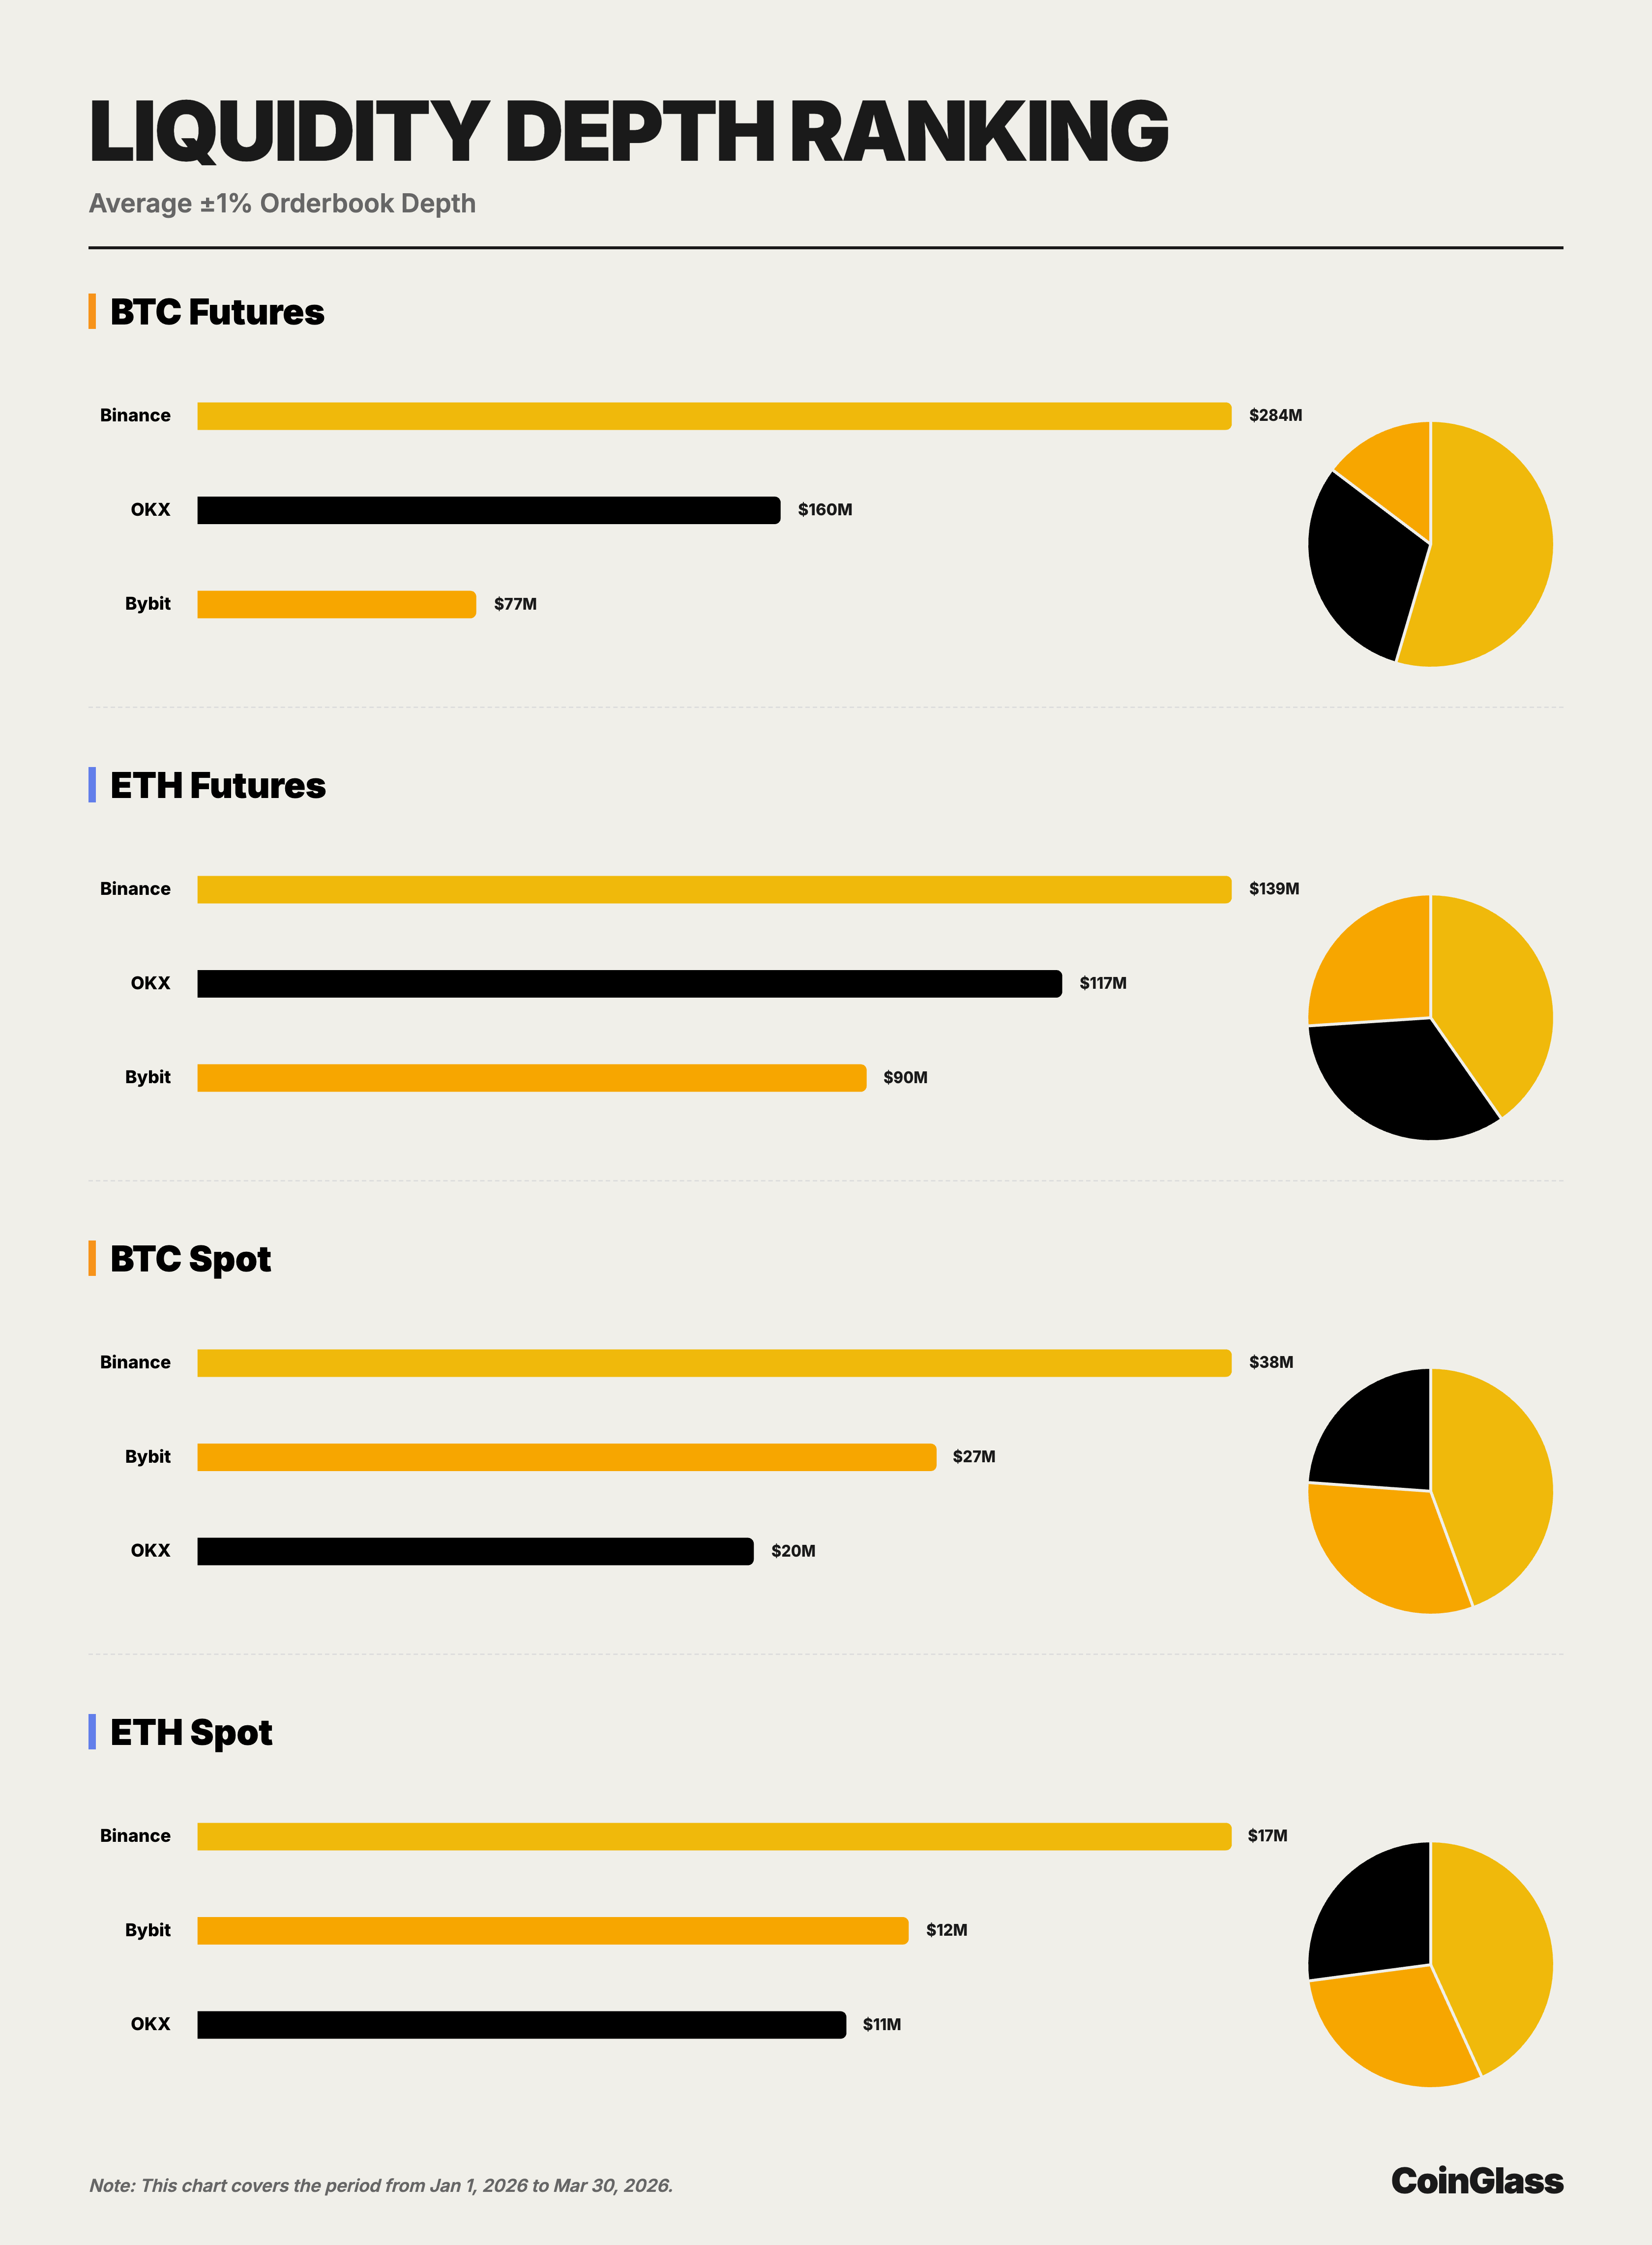
THE DATA IN THIS CHAPTER ARE BASED ON THE ORDER BOOK SNAPSHOTS, COMPARING THE MAIN PLATFORMS AT ± 1 PER CENT BILATERAL DEPTH IN THE SPOT AND CONTRACT MARKETS OF BTC AND ETH. THE DEPTH MORE DIRECTLY REFLECTS THE REAL CARRYING CAPACITY OF THE PLATFORM IN CARRYING OUT LARGE-VALUE TRANSACTIONS THAN TRADE VOLUMES AND THUS IS AN IMPORTANT BASIS FOR JUDGING WHETHER A “QUALITY LEADER” OF THE FRONT PLATFORM IS ESTABLISHED。
4.1 BTC MARKET DEPTH
In the BTC contract market, the average depths of Binance, OKX and Bybit were approximately $284 million, $160 million and $765.5 million, respectively. Binance is about 1.8 times the OKX and 3.7 times the Bybit, and maintains a significant lead. From an institutional trading perspective, this means that Binance has a direct implementation value by taking on orders of a higher size in the BTC contract market without over-exploiting the cost of shocks。
In the BTC spot market, the average bilateral depths of Binance, Bybit and OKX were approximately US$ 37.54 million, US$ 26.82 million and US$ 20.18 million respectively. Unlike the contract market, the second place on the BTC spot is occupied by Bybit instead of OKX, but Binance is still about 40% higher than Bybit and 86% higher. This indicates that Binance is first in the BTC cash and contract core liquidity pool, while the second platform rotates between sub-markets。
4.2 ETH MARKET DEPTH
In the ETH contract market, the average depths of Binance, OKX and Bybit were about $139 million, $117 million and $9.015 million, respectively. Compared to BTC contracts, the front-end competition in the ETH contract market is closer, the gap between OKX and Binance is reduced to about 16%, and the gap between Bybit and Binance is about 35%. Even so, Binance remains the first one, indicating that its lead is not only in the BTC single asset, but also in the ETH contract market。
In the ETH spot market, the average bilateral depths of Binance, Bybit and OKX were approximately $1.684 million, $1.158 million and $1,057 million, respectively. Similar to the BTC spot market, the second is still occupied by Bybit, but Binance is about 45% higher than Bybit and 59% higher than OKX. In terms of results, Binance ranked first in the four core sub-markets, and the second in the switch between OKX and Bybit, which further suggests that Binance ' s advantage is broader than its concentration on a particular asset or market。
4.3 Depth and volume of transactions
From the point of view of implementation capacity, depth is usually a better measure of the real liquidity quality of the platform than the turnover. Q1 data show that Binance is not only leading in terms of the size of the deal between the spot and derivatives, but also has the best depth in the BTC and ETH main trading scenes. OKX is more competitive in terms of contract depth, Bybit is closer to the head in terms of spot depth, but there is still no platform in four core sub-markets to put overall pressure on Binance at the same time, which means that Binance's lead has greater structural stability。
V. Repositioning of user assets
5.1 Size of asset reserves and trends
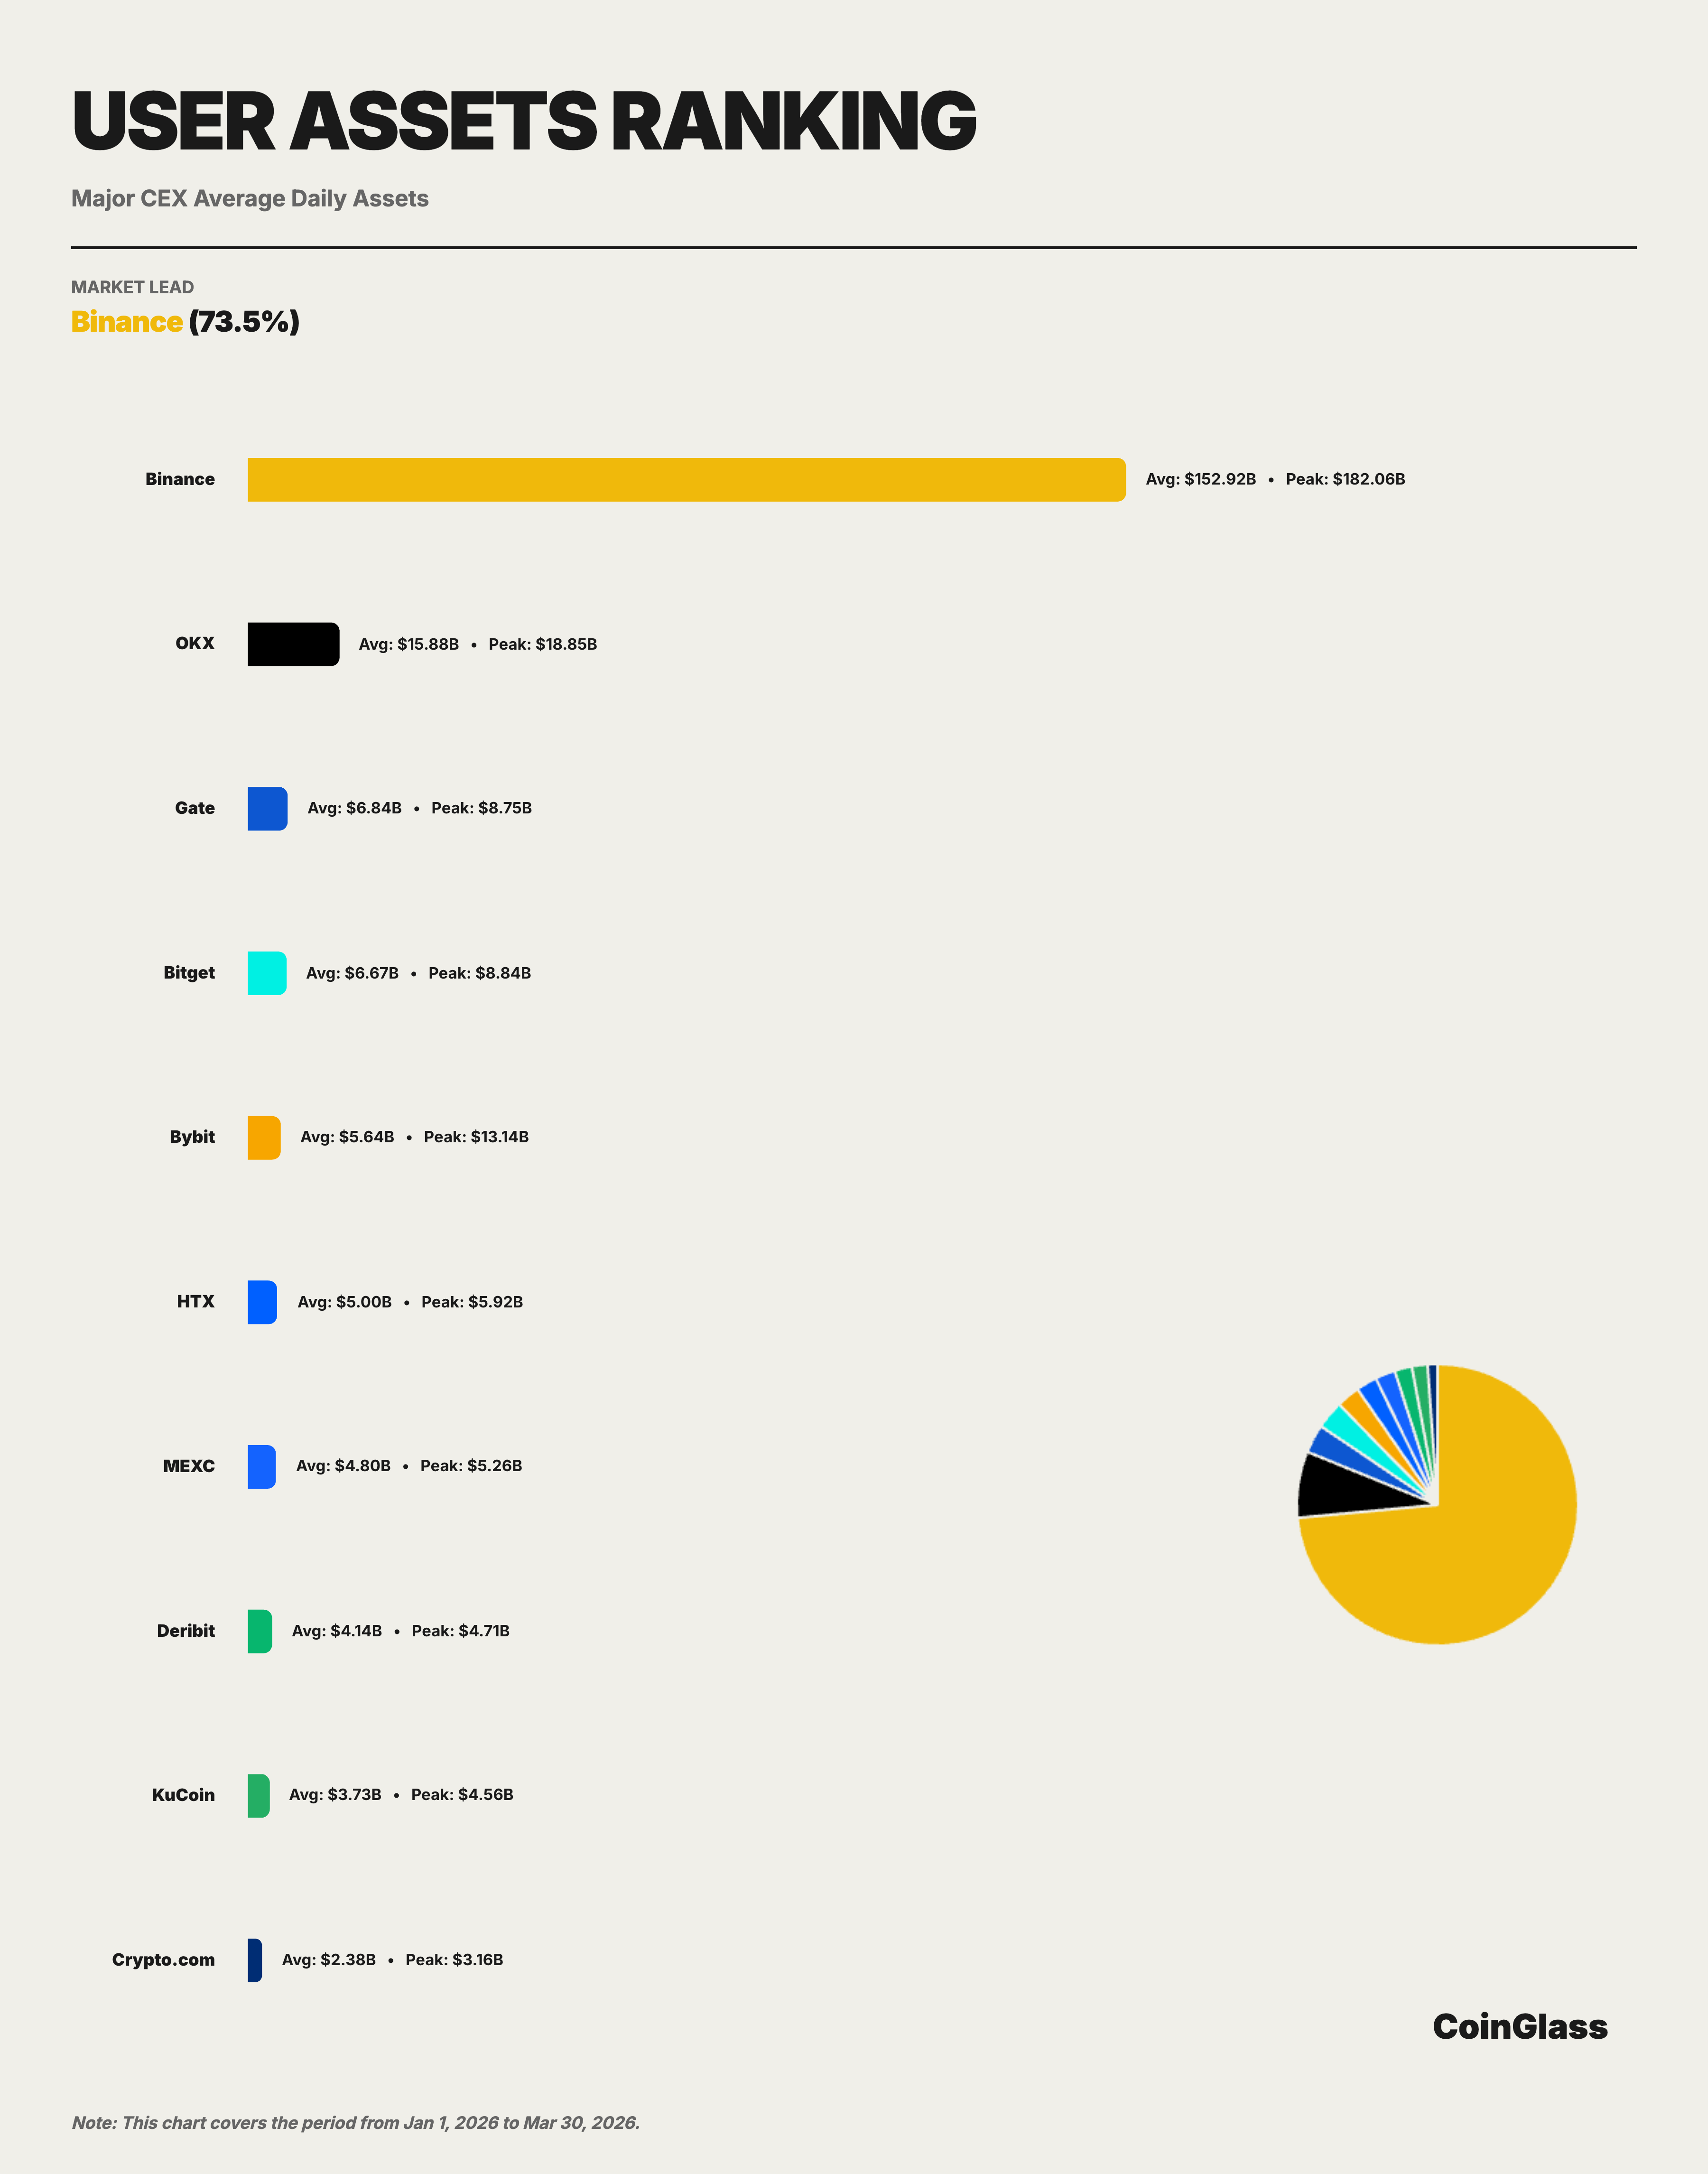
In 2026, Q1, Binance ' s average day-to-day hosting assets amounted to $152.9 billion, accounting for about 73.5 per cent of Top 10 exchanges. This ratio is much higher than Binance ' s market share in terms of volume of transactions (approximately 34.9 per cent) and dimensions of hold (approximately 29.9 per cent), which shows that Binance has a significantly higher concentration at the level of fund hosting than at the level of transactional activities. For an exchange, the deposit of user assets is often associated with brand trust, product ecology, chain-up access money accessibility and multi-business cross-use scenarios, and this indicator better reflects the platform ' s combined competitive position in terms of medium- and long-term dimensions。
In the light of monthly trends, Binance ' s trust assets have undergone a process of first-down and later stabilization in Q1. The average monthly average of $17.27 billion, a quarterly high, reflected the inflow of funds at the beginning of the year, which fell to approximately $136.4 billion in February, a decrease of about 21 per cent, in line with the downward trend of OI over the same period, and a small rebound to around $147.78 billion in March, which shows a generally stable trend of financial outflows. Quarterly peaks on January 15, about $182.1 billion。
Top 5 platforms, namely Binance, OKX, Gate, Bitget and Bybit, correspond to average user assets of approximately $15.29 billion, $15.9 billion, $6.8 billion, $6.7 billion and $5.6 billion. That is to say, with the main CEX caliber, only OKX has remained at over $10 billion, while the third to fifth platforms are concentrated between $5 billion and $7 billion, with the overall pattern of “the first significant lead, the second and the remaining relatively close”。
5.2 MAINSTREAM CEX ASSET DEPOSITION COMPARISONS
The market concentration of the sedimentary dimensions of the user assets is much higher than the volume of transactions and the silo dimension. In Top 10, Binance is headed by $15.29 billion, and the second, OKX, averaged about $15.9 billion a day, is only one tenth of Binance. The third to fifth, respectively, are Gate ($6.8 billion), Bitget ($6.7 billion), Bybit ($5.6 billion), which is close in size but with a quantitative gap with Binance — about eight times the sum of the three. The average user asset of Binance is approximately 9.6 times that of OKX, 22.4 times that of Gate, 22.9 times that of Bitget and 27.1 times that of Bybit. Binance's lead in asset sedimentation is much greater than its lead in derivatives trade and OO dimensions. This means that the market position of Binance is not only in terms of the dynamism of the transaction, but also in terms of the platform preference for the long stay of funds. Such leadership tends to be more stable and more difficult to replicate in the short term for industry competition patterns. This extremely concentrated distribution pattern means that Binance actually assumes a role of a similar “systemic infrastructure” at the level of hosting of user funds, whose operation and compliance have a magnifying effect on the robustness of the entire encryption market。
In the second, HTX ($5 billion), MEXC ($4.8 billion), Deribit ($4.1 billion), KuCoin ($3.7 billion) and Cripto.com ($2.4 billion) constituted the long end。
Comprehensive analysis and outlook
The following core judgements can be drawn from data that combine the four dimensions of transaction volume, holding stock, liquidity depth and settling of user assets:
First, the market leadership of Binance is comprehensive and solid. Binance ranks first in all core dimensions: derivatives trade of about $490 trillion (Top 10 share 34.9 per cent), OI averaged $23.9 billion (share 29.9 per cent), BTC contract depth of $284 million (share 54.6 per cent) and user assets of $152.9 billion (share 73.5 per cent). More importantly, Binance's lead in the depth of liquidity and asset hosting dimensions is much greater than the trade dimension, implying that its position as the core infrastructure of encrypted money markets is stronger than is implied by simple turnover rankings。
Second, the pattern of competition in derivative markets is being reshaped. OKX is currently the closest centralised platform for Binance, mainly in terms of the size and depth of the derivatives; Bybit is characterized by a relatively balanced trade volume, hold and spot liquidity performance; Gate maintains a relatively high level of presence with OI dimensions in derivatives, but relatively weak asset deposition; and Bitget is an important platform in the Second Plateau, with the top five positions in terms of derivatives trade and warehousing. At the same time, the traditional front-headed CEX-led derivatives market is being hit by two forces simultaneously: on the one hand, the compliance agency channel represented by CME and on the other, the decentrization agreement represented by Hyperliquid. The former mainly attracts hedging and spread transaction demand, while the latter attracts a number of high-frequency and tactical traders with their cross-censorship, portfolio and 24-hour uninterrupted features。
THIRD, THE MARKET AS A WHOLE IS MOVING FORWARD WITH PRUDENT REPAIRS. Q1 TRANSACTIONS CONTRACTED EACH MONTH AND OI WENT BACK AND DOWN STEADILY FROM THE TOP, REFLECTING THE MARKET AS A WHOLE DURING THE RESTORATION PERIOD FOLLOWING THE Q4 EXTREME EVENTS OF 2025. THE KEY VARIABLES TO BE ADDRESSED IN ENTERING Q2 INCLUDE: CLARITY OF THE FEDERAL RESERVE ' S MONETARY POLICY PATH; CHANGES IN BTC SPOT ETF FINANCIAL FLOWS; AND PROGRESS IN THE REGULATORY FRAMEWORK OF THE MAJOR JURISDICTIONS。
