
After foams, where to go: 2026 Digital Asset Market Analysis Report
The encryption bubble went out. Is Crypto really dead? This time, we choose to study bubbles. Even if the answer may be wrong, it is our own certainty。

Foreword: Identification and Uncertainty in Cripto
At the beginning of the year 2026, the whole market was anxious at the turn of the new round. After 1011, overall market liquidity began to dry up and, at a later stage, more teams chose to close or transform, except for a small number of head projects and businesses that remained alive。
And after Openclaw was born, when a new wave of technology swung, the great uncertainty worsened the panic and market liquidity shrunk, while countless Cripto workers chose to turn to AI, which had been focused only on Crypto's media outlets, where there was some more coverage of AI on the front page, and where the OG swung for more than a decade, "The encryption is dead."。
Encryption bubbles are out. Crypto really dead
Throw the question to AI, they can give countless answers. DeepSeek will tell you that the dividends of the encrypted market have disappeared, that now is the domain of professional compliance players, and that ordinary people have no chance; if you ask Grok, he will tell you that it's a Crypto 's turn-over, which will take out a group of people, but it will also let Crypto move in a better direction; if you ask Gemini again, it will say that AI 's development will lead to Crypto synchronized development。
The noise was too loud, so we wanted to find the answer to that question in our own way. There's nothing new under the sun, and we have a rare blurry memory, and that's what the market said when the Internet bubble just collapsed in 2001, even every bubble, as everyone said。
So this time, we choose to study bubbles。
Even if the answer may be wrong, it is our own certainty。
Historical cycle exploration: from railways to the Internet, how technology bubbles can cycle history

Railway glory and radio: the bubble of the industrial revolution
On September 27, 1825, the first British-made railway in the world: Stockton-Darlington. Three years ago, despite opposition from feudal nobility and religion, the capitalists saw the future value of this steel giant bet and eventually built. They believed that the technology would bring them benefits, but they were not aware of the implications for the whole era。
Although the first railway is merely a feeder of the canal transport system, thanks to its ease and value-for-money, the whole industry began to grow as it did after the rains, and investors chose to participate. At the end of the mining speculation bubble in South America in 1824-1825, these venture investors began to move to railway enterprises. In 1836-1837, as the stock market as a whole grew stronger, the stock price of railway companies doubled. The British Congress saw an opportunity and approved 44 companies during the year, whose total financing for the year easily exceeded the sum of all previous funds in the industry。
The rise, dissipation and resurgence of bubbles
Like countless bubbles in future generations, when a new technology is gradually recognized in the market, it will develop and collapse rapidly in a short period of time, and then, when the infrastructure is gradually improved, the new bubble will intensify and eventually return to the right path。
after the establishment of the company, the railway price index began to fall during the period, as the well-structured railway network had not yet been built and rail transport did not seem to have the traditional ease of water transport. by the early 1940s, however, the valuation had begun to rebound and to reach its peak. prior to 1843, the average annual investment of capital in railways was about pound1 million (approximately us$ 3.5 billion today), in 1844, that figure was £20 million (20x), in 1845 it was close to £60 million (60x), in 1846 it was £132 million (equivalent to $120 billion today), and in the same year, the total length of new railways reached a record level of 4538 miles. everything looks happy。
Fragmentation and return of value
It cannot be denied that the early railways were indeed successful business projects, but, thanks to investor optimism, stock prices quickly exceeded the level that railway stocks could achieve under rational valuation. The first railways did have a pre-emptive advantage, but without a threshold of access, that advantage would no longer exist. Adequate market capital, coupled with lower technology/market thresholds, is an excellent opportunity for subsequent competitors, and this will result in a shrinking margin of profits for the original enterprise, which will eventually create an environment in which industry-wide rates of return continue to decline, commonly known as the “inner volume”。
For market investors at this time, the first sign of the coming to an end of prosperity is the disappearance of large premiums on newly issued stocks, which can only be maintained by companies considered to be of higher quality. The expansion and occupation of high-quality land resources is undoubtedly the best option to maintain the firm ' s valuation and competitive advantage, which can be accelerated by leveraging bank loans, for railway enterprises still alive at this time. Worse still, as a result of emerging industries, most railway companies tend to underestimate the difficulty of railway construction, making the actual cost of railway construction much higher than the original valuation of their income statement. In the long run, these firms ' stocks have become a complete financial game: railways no longer have dividends from profits with businesses, but from capital funds and bank lending。
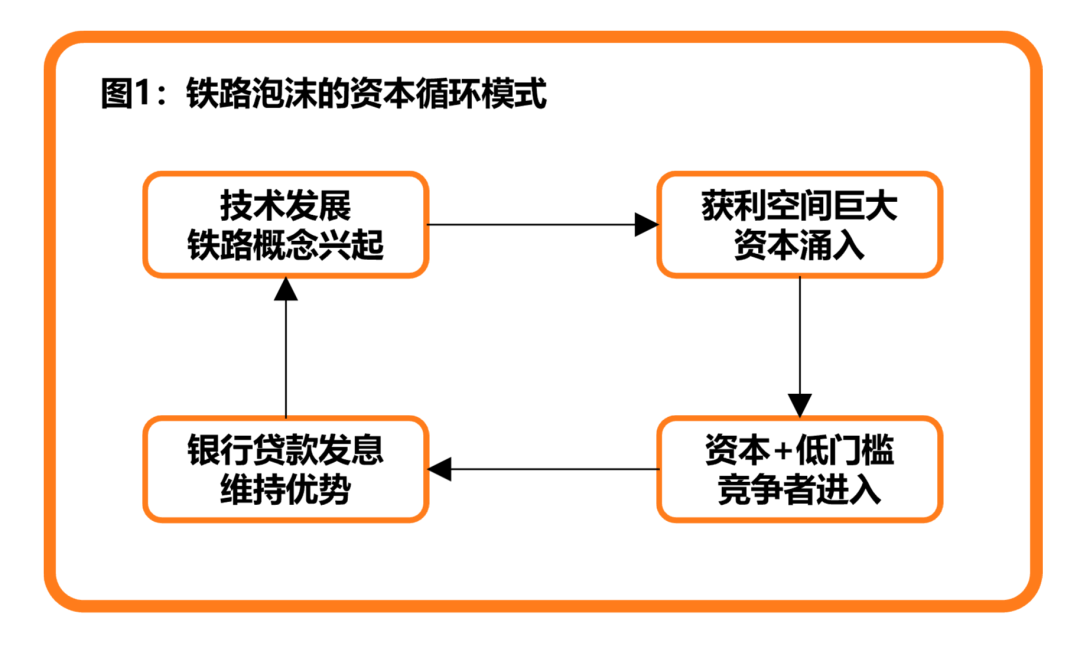
Under such a vicious wheel, bank interest rates are constantly being raised and, after a certain threshold, railway enterprises are no longer able to sustain this capital cycle, and the light of capital generated by technology suddenly fades. In one night, countless investors went bankrupt, and popular praise for railway enterprises turned into blame。
Faced with this situation, the British Government was forced to pass an Act of Parliament that would allow the railway industry to integrate and abandon nearly 20 per cent of the new railways that had been approved. The wave of mergers and acquisitions began with the recovery of the profitability of surviving enterprises. After that, British railway glory was no longer the kind of obscurantism, but more like a warm and slow morning sun shining over the land. Despite the difficulty of re-emerging the mad capital bubbles, the industrial revolution is being nourished。
Eventually, the same story, later in the American continent, happened again。
Marconi and Radio
As a footnote to the development of our times, the story of the railways has come to an end, and with the continuous development of the means of transport, the distance between the world and the world is gradually shrinking, through which people can reach further distances, or through wired telephones and telegrams, to make the delivery of information impossible。
Of course, the speed of information transmission should be more than that。
Following the systematic introduction of the electromagnetic wave theory by Scottish physicist Maxwell in 1865, some inventors began to experiment with a variety of electrical waves. Finally, in 1895, the lucky goddess visited the Italian inventor, Guglielmo Marconi. He believed that the distance could be further away when he succeeded in shaking the receiver 10 yards away through a self-study signal transmitter。
Marconi was keenly able to discover the future commercial value of this technology, to obtain a patent in 1896 and to start marketing his technology to government agencies, and soon set up Wireless Telegraph and Signal Company to develop and sell the equipment. As a cost of renouncing patents, Marconi received £15,000 (equivalent to $6 million today) in cash and £60 million (equivalent to $28 million today), which left Marconi no longer financially vulnerable. And this year, Marconi was only 22 years old。
From war to the market
As a rising star, Marconi was soon noticed from all walks of life. In the early days of the company, Marconi captured the global communications needs of the British Navy at the time and provided radio equipment sales and consultancy services to the British and Italian Navys in 1899. The first order amounted to Pound60 million (equivalent to $2.5 million today) and the annual income thereafter exceeded Pound30 million (equivalent to $1.25 million today)。
Despite the endorsement of cooperation at the national level, the market remains sceptical about the conventional commercial value of the technology. After several years of trial missed, Marconi adjusted his business model and adjusted its sales strategy from direct sales to lease. Compared to traditional paths, the greatest feature of this approach is ecological construction. Through such cooperation, he allows any product or enterprise to use a radio product only after paying part of the rent, with the sole limitation that all customers can communicate only with other Marconi clients。
It is this strategy that has begun to produce numerous radio stations and competitors of the same kind。
The birth of the Radio Concept Unit
With the addition of Marconi and other technology competitors, the entire radio industry began to flourish, with countless capital inflows. In the early days of Marconi, although the company ' s financial statements showed that it was in a state of loss, this did not discourage investors ' enthusiasm: technology and business models were at an early stage of development and losses were not unacceptable. After that, Marconi changed its name to RCA, and the accumulated technological advantages and business networks it built in the United States began to add value at this time. They brought together patents owned by AT& T, GE, RCA and Westhouse Electric, forming an indestructible commercial fortress, which led to an explosion in sales revenues and profits for RCA。
ONE PERSON, A CHICKEN DOG UP, AND AN UPSTREAM-DOWNSTREAM COMPANY ASSOCIATED WITH THE RCA HAVE BENEFITED FROM THIS TECHNOLOGY DIVIDEND, AND AT THE HEIGHT OF THE WHOLE MARKET, SOME PEOPLE CAN EASILY FINANCE THE MARKET AND MARKET THEIR OWN SHARES BY SIMPLY REGISTERING A “RADIO” COMPANY. AND THE STORY THAT FOLLOWS IS THE SAME AS THE PREVIOUS RAILWAY DIVIDEND: NUMEROUS CAPITAL AND CORPORATE INFLOWS UNDER THE DIVIDEND BEGAN TO DISINTEGRATE, AND BANK LOANS BEGAN TO SPLIT AS DIVIDENDS, CULMINATING IN THE COLLAPSE OF MARKETS AND THE COLLAPSE OF DIVIDENDS. IN CONTRAST TO RAILWAYS, THE COMMERCIAL VALUE OF RADIO TECHNOLOGY HAS BEEN SO LANDMARK THAT THE TECHNOLOGICAL BOOM HAS LASTED FOR ALMOST TWO DECADES, AND WHEN THE RADIO INFRASTRUCTURE IS COMPLETED, FROM RADIO, RADIO, TO TELEVISION AND RADIO MEDIA, IMAGINE SPACE ENOUGH TO KEEP THE MARKET AT A PROSPEROUS LEVEL IN THE LONG RUN。
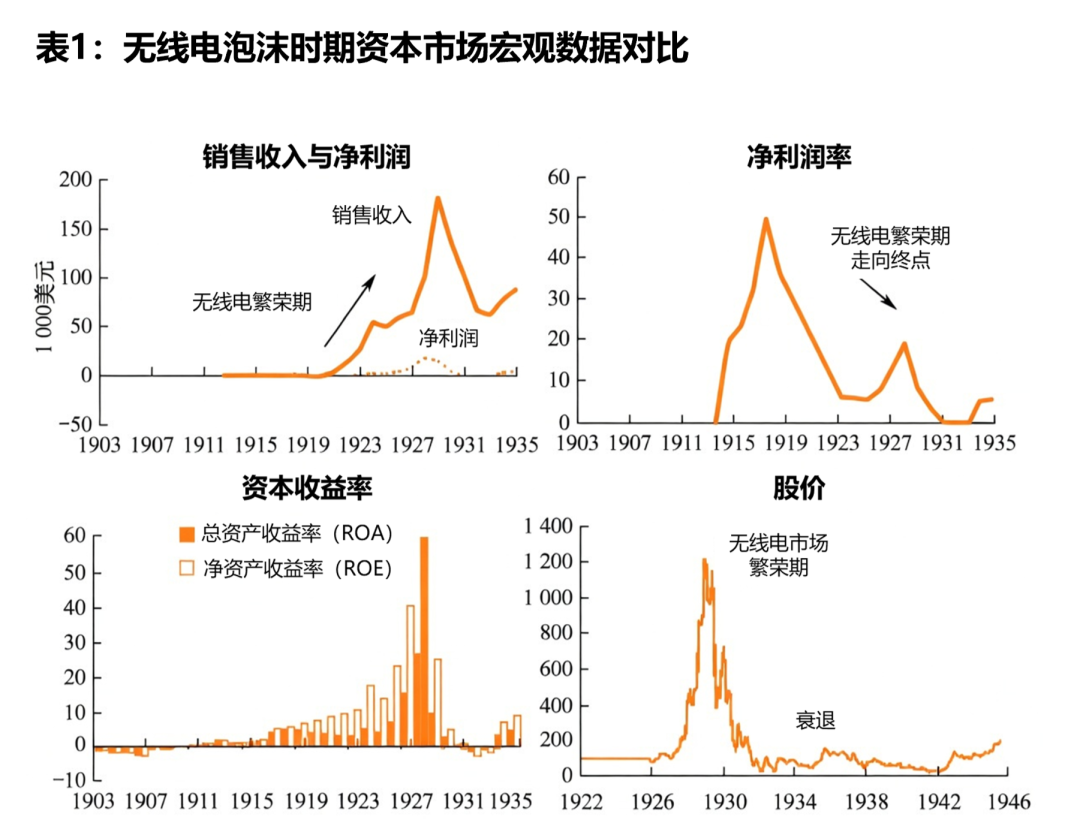
In the end, the Great Depression began, capital games became unsustainable, and people had to find more difficult but practical ways to raise real sales revenues and net profits from companies and products。
Top of the Internet Wave: A new round of technological and social experiments
After IBM tried to develop a personal computer, which was facilitated by Apple, the penetration of computers in the mass market reached a new level, which meant that some of the technologies that existed only in research laboratories began to emerge — the Internet。
From the ivory tower to the business. Field
The origin and birth of the Internet has become an old topic and will not be repeated here. The way the Internet is commercialized is clearly more worth learning than its birth。
The National Science Foundation of the United States (NSF) decided to relinquish control over the National Research and Educational Research Network (NREN) and to transform the privatization into a self-profit operation. In the process, numerous key elements have emerged that have made possible the social application of the Internet: Apple PC provides a hardware base, the World Wide Web provides a framework and Mosaic provides entry points. With the commercial transformation of NREN, a giant industry began its vast life。
In the early stages of commercialization, this opportunity was not seen by all, and more relevant firms chose conservative practices. On the one hand, their knowledge reserves and insights did not make them aware of the potential opportunities inherent in the Internet; on the other hand, in the business environment at the time, the industrial giants were more likely to generate revenue for themselves by running circles and building their own ecology, and they were bound to be naturally excluded from this new environment of extreme openness. Nevertheless, this is not bad for industry development: the resistance of giants provides ample market space and opportunities for new entrants。
Net view: The first person to eat crabs
As the first group of crab-eating businesses, the peak of the webscape is indeed a boost to the entire market. At the end of 1994, Marseic communications were in legal dispute because they were identical to Mosaic's name and eventually changed to Netscape Communications Corporation。
WHILE THE COMPANY STILL HAS $12 MILLION ON ITS BOOKS AT THIS TIME, THE $1 MILLION PER MONTH OF CASH SPENDING HAS FORCED THE NET TO TAKE INTO ACCOUNT THE TRANSFORMATION OF THE BUSINESS MODEL, WHICH, IN OPERATIONAL TERMS, CHANGED THE PREVIOUS SERVICE MODEL BY RAPIDLY TAKING OVER A LARGE NUMBER OF MARKETS WITH THE OVERWHELMING ADVANTAGE OF THE PERFORMANCE OF ITS PRODUCTS, BY 30 DAYS OF FREE TRIAL + 49 SUBSEQUENT SERVICE FEES. THE IDEA WAS TO MAKE IT LOOK BETTER ON THE MARKET THROUGH MARKET RATES, BUT IT WAS NEVER USED TOO WELL. IN AUGUST 1995, IPO, THE NETSCAPE PUBLIC FUND WAS RAISED FOR $140 MILLION, BRINGING THE NET TO ITS PEAK。
HOWEVER, THE SUCCESS OF THIS MARKETING STRATEGY HAS MADE THE WEB SCENE SO GLAMOROUS THAT IPO'S PLEASURE HAS NOT TAKEN INTO ACCOUNT HOW TO BUILD ITS OWN MOAT. THEY HAVE NEITHER BEEN ABLE TO CONSOLIDATE THEIR UPPER AND LOWER MOATS THROUGH BUSINESS ACQUISITIONS, NOR HAVE THEY BEEN ABLE TO MAKE THEIR PRODUCTS MORE USEFUL BY DEEPENING THEM, AND EVEN COMMERCIAL COOPERATION WITH THE INDUSTRY HAS BEEN UNHEEDED, CHOOSING INSTEAD TO REMAIN THE MOST FOOLISH。
The end was also clear: when the market discovered the giant cake, which had already been tested by the pioneer of the Netscape, there was an influx of competitors who eventually acquired it online in the United States。
A whale falls, everything comes to life
The story of the webscape is a lamentable one, but it is, in general, a matter of interest to market development, in which countless profit-makers and innovators join the adventure, from which obnoxious projects emerge. Almost the same year of success, Jerry Yang and David Filo spent a great deal of time studying browser needs and eventually completed an extremely efficient information index system, which they named Yahoo, while Sergei Brin and Larry Page at Stanford University tried to explore on the information search engine how to find the information they wanted more quickly on the Internet. When these ideas crossed the sea, Ma Yun was inspired and preparations began for the development of the China Yellow Page。
The extreme of the concept bubble
It is clear that Internet technology has a lower threshold of access than used rail technology and radio technology, and that it does not require us to hire workers to build rail linkages or to obtain relevant access qualifications through government. You can do whatever you want with your Internet knowledge. Large wealth effects were matched by lower access thresholds, and a capital market party had begun。
AT THE BEGINNING OF THE BUBBLE, THE CAPITAL MARKET WOULD HAVE BEEN CAUTIOUS, BUT WHEN THEY SAW THAT YAHOO AND GOOGLE WERE BORN OUT OF “CARPAGES” AND THAT THEY WERE ABLE TO EARN ENOUGH THROUGH PRE-EXISTING BUSINESS MODELS, THEY REALIZED THAT THE ORIGINAL MARKET VALUATION LOGIC SEEMED TO HAVE BEGUN TO FAIL, AND THAT THE PRICES OF VARIOUS INTERNET TECHNOLOGY SHARES HAD RISEN RAPIDLY, AND INVESTORS HAD LONG SINCE LEFT THEIR PREVIOUS SUSPICIONS BEHIND. ULTIMATELY, FOR BASIC INVESTORS, THE VALUATION OF THE TNT SECTOR HAS BEEN EXAGGERATED WITHOUT CARE OR SELECTIVITY, AND ALMOST EVERYONE CONSIDERS IT TO BE WITHOUT PROBLEMS。
Professional analytical standards are also beginning to deform as enterprises move towards bolder valuations. Typically, the higher the equity price, the more profit-sheet-based analysts tend to arrive at a higher valuation, and in order to ensure the reasonableness of the valuation, the valuation base gradually shifts from profitability to income when the previous profit anchor no longer supports current prices, and then disassembly from income to concepts such as “hit rate” “retention rate” and uses it to analyse the market prospects of a company in the coming years. The whole logic is reasonable, but one of the deadliest is how to ensure the effectiveness of the analysis of the business model, without reference to past cases, and the only way forward is to listen to the analysis of the founding team, that is, “story telling”。
ULTIMATELY, INSTEAD OF PAYING FOR TECHNICAL PRACTICALITY, PEOPLE CHOOSE TO PAY FOR STORIES — WHO IS MORE PERSUASIVE AND MORE PROMISING AND WHO IS LIKELY TO RAISE MORE MONEY. A REAL FOMO STARTED, AND PEOPLE STARTED TO DO BUSINESS CAREFULLY, BUT AS THE MARKET BECAME MORE IMPATIENT, PEOPLE FOUND THAT EVEN THEIR OWN BUSINESS HAD NOTHING TO DO WITH THE INTERNET, BUT IF THEY REGISTERED A WEBSITE, THEY COULD BE CLASSIFIED AS THE TNT INDUSTRY AND ENJOY MARKET DIVIDENDS. IT IS UNDENIABLE THAT THERE ARE SOME VERY ADVANCED PROJECTS IN THIS STORY FAIR, SUCH AS ONLINE SHOPPING, ONLINE MARKETING AND EVEN ONLINE PET CARE. THE PROBLEM, HOWEVER, IS THAT WHEN THE INFRASTRUCTURE IS NOT YET COMPLETE, THE STORY IS ONLY A STORY。
In the end, the same endings are happening again, with few of the businesses in the stock market that were really fit and left behind, and more to sustain this false boom through bank lending until bank interest rates reach a certain threshold and the market collapses。
Data-driven foam indicator: how Internet valuation is headed for failure
History's stories have been simplistic, but if more valuable information is to be found, we need to move from these narratives to quantifiable and comparable macro-financial indicators, from which we need to find patterns。This section uses Internet bubbles (1995-2002) as a core sample, supported by historical data from before and after the Great Depression in 1929, to present systematically the evolutionary path of macro-data in the foam life cycle from four dimensions — valuation indicators, the monetary environment, capital flows, the real economy. These regular trends will provide a solid “non-variant” benchmark for cyclical analysis of the Cripto market in subsequent chapters。
Extreme expansion of the P/E Ratio
The most visible signs of foam are reflected in the valuation indicators. In each round of technology bubbles, the market's optimism about new technologies is expected to push up the valuation multiplier until it is removed from any reasonable fundamentals。This process is a gradual “locking drift” in which investors gradually accept increasingly disproportionate valuation levels until the entire valuation system fails collectively。
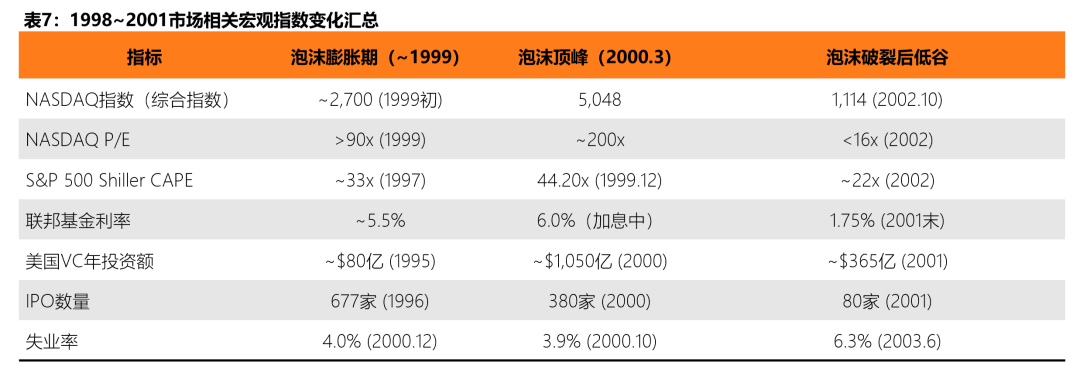
DURING THE INTERNET BUBBLE, THE MARKET GAIN OF THE NASDAQ COMPOSITE INDEX JUMPED TO ABOUT 200 TIMES AT ITS PEAK IN MARCH 2000, WELL ABOVE THE PEAK OF THE JAPANESE ASSET BUBBLE, WHICH GREW BY 225 TIMES 60-80 TIMES. THIS FIGURE MEANS THAT INVESTORS ARE WILLING TO PAY $200 FOR EACH DOLLAR OF CURRENT PROFITS — IN OTHER WORDS, IT WILL TAKE 200 YEARS FOR INVESTORS TO RECOVER COSTS EVEN IF THE PROFITS OF THE COMPANY ARE NOT INCREASED AT ALL. MORE NOTABLY, MORE THAN HALF OF THE TECHNOLOGY COMPANIES LISTED IN THE NASDAQ ARE IN A STATE OF LOSS AT THE PEAK OF THE BUBBLE AND ARE UNABLE TO CALCULATE MEANINGFUL P/E VALUES。
At the same time, S& P500 was in the range of about 29–33 times in 1999–2000, and more than 45 times the number of readings appeared around 2002 — with a long-term historical average of only about 15–20 times. The NASDAQ index was still 175 times higher in March 2001, suggesting that even if the foam started to break, the return to market valuation was far from complete。
Sheller CAPE Ratio: valuation early warning across the century
The cyclically adjusted rate of gain (CAPE, also known as Sheller P/E or P/E 10) developed by the Nobel laureate in economics, Robert Sheller, smooths short-term fluctuations by using the inflation-adjusted average profit of the past 10 years, which is widely regarded as one of the most reliable indicators to measure the market ' s level of long-term valuation. Of the historical data from 1881 to date of more than 140 years, S& the median CAPE of P 500 is 16.04 times, with an average value of about 17.17 times。
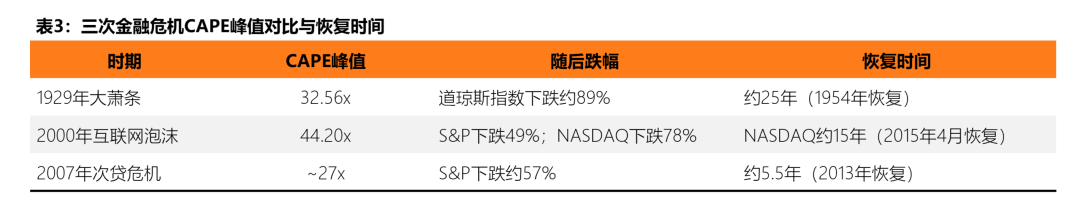
In each of the three landmark bubbles, CAPE significantly exceeded 30 times the “danger threshold”: 32.56 times before the Great Depression in 1929, followed by a market collapse of 89 per cent, with the index not fully recovered until 1954; 44.20 times the record of the Internet bubble in 2000, followed by S& and P500 falling by 49 per cent in 2000-2002, NASDAQ by 78 per cent and investors receiving only about -1.4 per cent of the annualized real returns during the decade 2000-2010. Historical data show that when CAPE is more than 30 times the average annualized real rate of return for the following decade is 0-3 per cent, well below the long-term average of about 7 per cent。
It is worth noting, in particular, that CAPE is not a “time-select” tool — high CAPE cannot predict when the crash will take place, but it is very effective in predicting a low-return zone for the next decade. As the Fed Reserve Bank of Minneapolis noted in its study, the destruction of stock market investors’ wealth, despite the relatively moderate impact on the real economy, followed the collapse of the technological bubble in 2000。
EXTREME DIVISION OF MARKETING RATES (P/S)
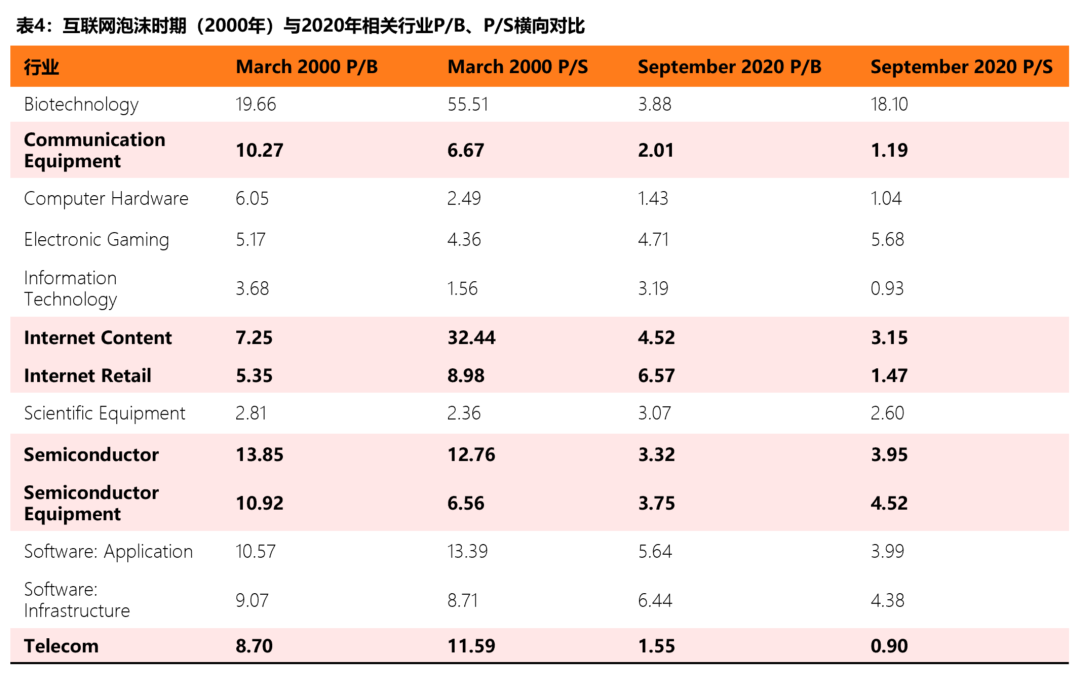
THE P/E RATIO HAS EFFECTIVELY LOST ITS REFERENCE VALUE BECAUSE OF THE LARGE NUMBER OF LISTED COMPANIES AT THE PEAK OF THE BUBBLE (OVER HALF OF NASDAQ LISTED TECHNOLOGY COMPANIES IN MARCH 2000). THUS, MARKETING (P/S) IS A MORE RELIABLE INDICATOR OF FOAM SEVERITY。
The CFA Institute study showed that in March 2000 the median P/S for Internet Content was 32.44 times, while in September 2020 the median P/S was only 3.15 times - more than 10 times the gap. The median net market rate for semiconductor plates (P/B) also decreased from 13.85 times in 2000 to 3.32 times in 2020。
The double-edged sword of monetary policy: the soft-foamed, tight-strangling bubble
Behind each large-scale asset bubble is the appearance of a loose monetary policy. Interest rate levels determine the “opportunity costs” of capital, and when the risk-free rate of return is very low, the funds naturally flow to high-risk, high-return assets, providing the most fertile ground for speculation. Foam vulnerability is revealed when central banks move towards austerity and higher interest rates raise financial costs。
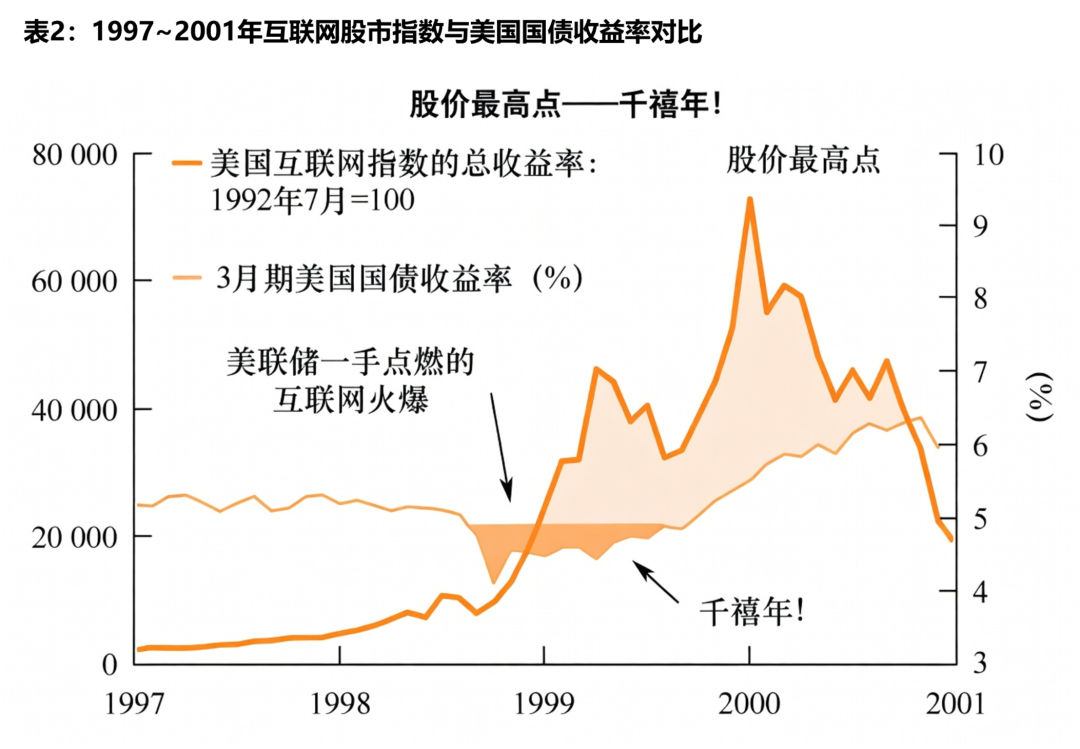
Easier cycle: Foam catalyst。The monetary policy context of the Internet bubble began in the mid-1990s. Between 1995 and 1998, under the leadership of Alan Greenspan, the Federal Reserve maintained a relatively relaxed interest rate environment, with federal funds holding interest rates at approximately 5.25-5.5 per cent. More critically, in autumn 1998, the long-term capital management firm (LTCM) raised systemic risk concerns about the collapse of hedge funds, with the Fed dropping interest rates from 5.5 per cent to 4.75 per cent on three consecutive occasions. Looking back at the period, Goldman Sachs made it clear that the drop in interest rates after the LTCM incident “released significant liquidity” directly contributed to the jump of NASDAQ from 11 per cent of NYSE transactions in 1990 to 80 per cent of the market value of the total stock market in 1999. This “insurance drop” round in 1998 greatly boosted investor confidence — The Globe.com, in November of that year, when IPO first-day stock prices surged by over 600 per cent, creating a Wall Street historical record。
Austerity cycle: The end of the bubble。Since June 1999, the Fed has been aware of the risk of overheating assets and has started a cycle of consecutive interest-rate hikes. Within 10 months, the Federal Reserve increased interest rates six times, from approximately 4.75 per cent to 6.5 per cent in May 2000 - an extremely high level since January 1991 and a discount rate of 6 per cent (one of the highest levels since August 1991). This series of austerity operations significantly increased borrowing costs, made fixed-income products such as bonds more attractive than high-risk technology units, and funds began to be withdrawn from speculative assets。
It is important to emphasize that interest rate changes do not puncture bubbles in isolation and are more like key variables in a range of catalytic factors. On March 13, 2000, Japan announced that a relapse into recession had triggered a global sale, and on March 20, Barron's published a “Burning Up” cover article warning Internet companies that they were running out of cash and that same month MicroStrategy was forced to recapitulate (62 per cent stock price per day) as a result of radical accounting. Interest rate rises + external shocks + confidence collapses, which together constitute a complete trigger chain for bubble break-ups。
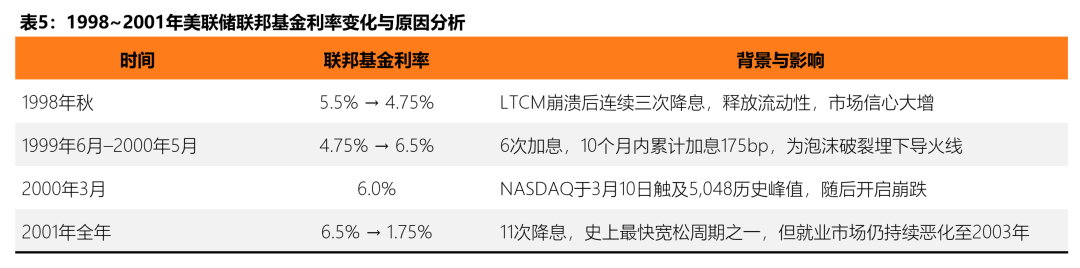
The Federal Reserve also turned fast after the foam burst. Throughout 2001, the Fed reduced interest rates to 11 times, reducing federal fund interest rates from 6.5 per cent to 1.75 per cent, one of the fastest liberal cycles in its history. However, the drastic decline in interest rates did not stop the continuing deterioration of the job market - the unemployment rate reached a peak of 6.3 per cent in June 2003, three years later than the bubble burst. This time lag in monetary policy for the real economy is key to understanding the consequences of bubbles。
CAPITAL FLOODING AND LEVERAGE ACCUMULATION: FROM VC TIDES TO SPRAWL BAR
If the valuation indicator is the “thermometer” of the foam and monetary policy is the “fireplace”, then venture capital (VC), IPO market and bond loan (margin debt) is the “fuel” accumulated in the foam。ONE OF THE CORE FEATURES OF THE FOAM BOOM PHASE IS THE INCREASINGLY RAPID AND LOW THRESHOLD AT WHICH CAPITAL FLOWS INTO SPECULATIVE ASSETS — FROM SPECIALIZED VENTURE CAPITAL AGENCIES TO IPO UNDERWRITING BY INVESTMENT BANKS TO LEVERAGE TRANSACTIONS BY ORDINARY BULKHOLDERS — CREATING A COMPLETE CHAIN OF SPECULATION。
Venture investments: from pick to pick。The scale of risk investment during the Internet bubble experienced explosive growth. According to NVCA, annual VC investment in the United States surged from about $8 billion in 1995 to a peak of about $105 billion in 2000 (at current year prices), an increase of 13 times in five years. By 1999, 39 per cent of VC investments in the United States went to Internet companies. The immediate consequence of this capital boom has been a sharp decline in the quality of the project — a large number of start-ups lacking a clear profit path can obtain substantial financing only with a domain name with a “.com” suffix。
After the foam burst, VC funds retreated like tides. VC investments fell sharply to about $36.5 billion throughout 2001 - although still at the third highest level in history, they have shrunk by more than 67 per cent compared to their peak in 2000. The CFA Institute study further noted that the VC Fund ' s average internal rate of return (IRR) for 1999 ultimately recorded -4.29 per cent, and was lower to -2.51 per cent in 2000 - In other words, the institutional funds that come in at the height of the bubble end in loss。
IPO MARKET: FROM FEAST TO FREEZE。The number of IPOs is one of the most sensitive wind indicators of speculation in the market. The number of IPOs in the United States peaked at 677 in 1996 and has since undergone a brief adjustment of 474 in 1997, 283 in 1998 and rebounded to 476 in 1999. In 2000, 380 companies were still listed at the end of the bubble. In 2001, after the foam burst, the figure dropped sharply to only 80 households - less than a quarter of the previous year. During 1999, more than 280 VC-backed companies completed IPOs, many of which increased by more than 100 per cent on the first day of their listing. VA Linux experienced a 698% surge in IPO's first day on December 9, 1999 and is still one of the most extreme IPOs in the United States market。
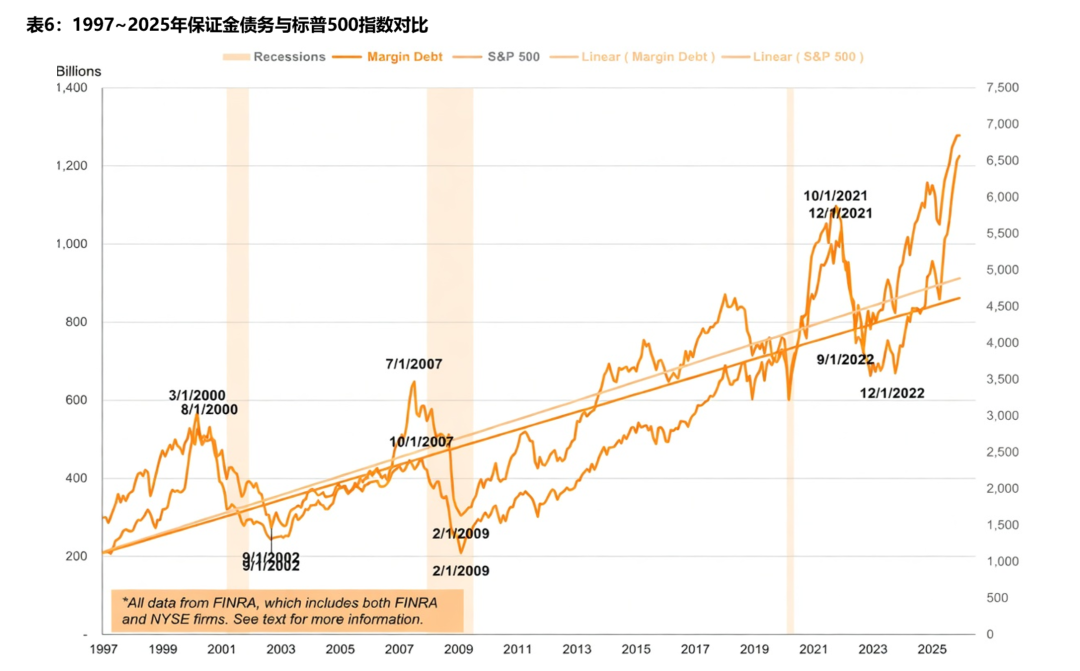
Bond debt (Margin Debt): Maximum leverage。Market-to-market guarantee loans (margin debt) are core indicators of market leverage levels and speculation. At the end of the 1990s, following a massive influx of diaspora investors into the stock market, Margin debt experienced a dramatic rise, and in March 2000 - synchronized with the NASDAQ index and VC investments - reached a peak of about $300 billion (in 2000 dollars, the contract was $500 billion in current value). Margin debt ' s share of nominal GDP reached 2.6 per cent at the time of the Internet bubble, a level that was again brought closer (2.5 per cent) before the subprime crisis in 2007 and significantly exceeded (3.97 per cent) in 2021。
During the market collapse in 2000, not only did individual investors not withdraw in time, but rather accelerated access. According to the data, the net investment of diaspora investors in the stock market was about $260 billion throughout 2000, up from $150 billion in 1998 and $176 billion in 1999. By the end of 2002, about 100 million individual investors had accumulated losses of about $5 trillion in market value. According to Vanguard ' s study, 70 per cent of the 401 (k) retirement accounts had lost at least 20 per cent by the end of 2002. This data reveals the typical pattern of foam-dwelling behaviour - While institutional and internal actors are already in large numbers, dispersed households tend to be the last receivers。
THE LAG IN THE REAL ECONOMY: GDP CONTRACTION, JOB COLLAPSE AND JOBLESS RECOVERY
The impact of a bursting asset bubble on the real economy is often not instantaneous, but spreads along a chain of transmission from financial markets to business investment and to the labour market. The recession in the United States after the Internet bubble, although moderate at the GDP level, has left deep and lasting scars at the employment and business investment levels, a typical example of what economists call a “jobless recovery”。
GDP: THE SYMPTOMS OF SHALLOW RECESSION AND THE NATURE OF DEEP TRAUMA。THE UNITED STATES NATIONAL BUREAU OF ECONOMIC RESEARCH (NBER) DEFINED MARCH TO NOVEMBER 2001 AS AN ECONOMIC DOWNTURN LASTING ABOUT EIGHT MONTHS. AT THE GDP LEVEL, THE RECESSION WAS INDEED RELATIVELY MODERATE - REAL GDP CONTRACTED BY ONLY ABOUT 0.3 PER CENT CUMULATIVELY, WITH AN ANNUAL DECLINE OF ABOUT 1.3 PER CENT IN THE THIRD QUARTER OF 2001. BUT GDP FIGURES MASK THE DEEP STRUCTURAL TRAUMA: FIXED INVESTMENT (EXCLUDING STOCKS) DECLINED CONTINUOUSLY FROM 2001 TO THE BOTTOM IN THE THIRD QUARTER OF 2002. BETWEEN 1996 AND 2000, REAL COMMERCIAL FIXED INVESTMENT IN THE UNITED STATES GREW AT AN AVERAGE ANNUAL RATE OF ABOUT 10 PER CENT, AND THIS INVESTMENT BOOM EXPERIENCED A SHARP REVERSAL AFTER THE BUBBLE BURST - A DECLINE IN BUSINESS INVESTMENT WELL ABOVE HISTORICAL AVERAGES。
Employment market: from historical lows to continuous deterioration。EMPLOYMENT DATA TELL STORIES THAT ARE MUCH WORSE THAN GDP. THE UNEMPLOYMENT RATE IN THE UNITED STATES CONTINUED TO RISE FROM 4.0% IN SEPTEMBER-OCTOBER 2000 (LOWER 30 YEARS) TO A PEAK OF 6.3% IN JUNE 2003 - AND IT'S BEEN A YEAR AND A HALF SINCE NBER DECIDED THAT THE RECESSION ENDED IN NOVEMBER 2001. THIS ANOMALOUS PATTERN OF “END-OF-RECESSION BUT UNEMPLOYMENT CONTINUES TO WORSEN” IS KEY TO UNDERSTANDING THE LEGACY OF THE TECHNOLOGICAL BUBBLE. THE UNITED STATES DEPARTMENT OF LABOR ESTIMATES THAT THERE WAS A NET DECREASE OF ABOUT 17.35 MILLION JOBS IN 2001 AND A NET DECREASE OF ABOUT 588 MILLION IN 2002. BY THE END OF 2002, UNEMPLOYMENT IN THE UNITED STATES HAD INCREASED FROM ABOUT 5.6 MILLION AT THE END OF 2000 TO ABOUT 8.4 MILLION, AN INCREASE OF 2.8 MILLION, OF WHICH THE NUMBER OF LONG-TERM UNEMPLOYED (OVER HALF A YEAR) REACHED 1.7 MILLION。
Employment in the science and technology sector is the first. It is estimated that between 2001 and early 2004, approximately 200,000 jobs were lost in Silicon Valley alone. Manufacturing output declined cumulatively by 7.6 per cent from its peak in September 2000 to the end of 2001, well above the 5.1 per cent decline during the 1990-91 recession. This structural employment loss is different from the previous recession, which averaged about three months after the previous recession and usually exceeded its previous peak in 10-15 months, while the full recovery of employment after the 2001 recession continued beyond 2004 and became one of the longest recovery cycles since World War II。
Summary: Four-stage evolution model of foam macrodata
Combining the data analysis of the four dimensions above, we can sum up a set of four-stage evolutionary models from the onset to the breakdown of the technology bubble from macro-indicators, which were repeatedly validated in railway bubbles, the Great Depression of 1929 and the Internet bubble of 2000:
•Phase I: Moderate deviation from valuation (premature)。NEW TECHNOLOGIES HAVE EMERGED, WITH EARLY ADOPTERS AND PROFESSIONAL CAPITAL TAKING THE LEAD. THE VALUATION MULTIPLIERS BEGAN TO EXCEED HISTORICAL AVERAGES (E.G. CAPE BREAKTHROUGHS 20 TIMES), BUT ARE NOT YET OUT OF INTERPRETABLE RANGE. INTEREST RATE CONDITIONS ARE RELAXED, VC SIZE IS GROWING STEADILY, AND MARKET SENTIMENT IS OPTIMISTIC BUT RATIONAL。
•Phase II: accelerated valuation escalation (defunct period)。Easier monetary policy combined with technical narratives led to positive feedback cycles. CAPE exceeded 30 times the “danger threshold”, with extremes in P/E and P/S for specific plates (e.g. NASDAQ P/E & gt; 100x). VC investment volume index increases (over 100 per cent annual growth) and the number of IPOs and first-day increases are record. Massive entrance, margin debt synchronized surge. Market participants began to quote the new framework to rationalize extreme valuations。
•Phase III: valuation collapse and liquidity depletion (crash period)。Central bank interest rate hikes or external shocks trigger a breakdown in confidence. Asset prices fell sharply by 50-80 per cent in months. VC fund depletion (over 60 per cent annual decline), IPO market freeze, margin call triggers forced silo cascade effect. The most extreme assets valued in foams (non-profit companies, conceptual projects) are first zero。
•Phase IV: Physical economic transmission and long rehabilitation (adjustment period)。GDP experienced a moderate contraction, but employment losses were severe and lasting well beyond recession itself (unemployment lags 2-3 years before peaking). Business investment contracted significantly, and markets moved from speculative growth to focus on profitability and cash flows. The regulatory framework is tightened afterwards (e.g. Sarbanes-Oxley Act). Survivors (e.g. Amazon) experience years of revaluation and eventually become the cornerstone of a new round of growth. The complete recovery of the index may take 5-15 years or even longer。
The core insight of this model is that, while the variables for each foam vary (technical vehicle, market structure, participant composition), the bottom patterns revealed by macrodata are strikingly consistent:

And that's the "no variables" base that we can rely on when we map this model to the Crypto market in the following chapter。
II. Crypto ' s multi-wheeled oxen bear: economic trend cycles that belong exclusively to the block chain

BTC INDEPENDENT EVOLUTION: FROM PASSWORD EXPERIMENT TO INSTITUTIONAL RISK ASSETS
Most of the foams of the past have become dusty, and new bubbles are in us. If you've been through Crypto's multi-cow bear, you might feel the same way about these foam patterns。
So, in this section, we'll use the BTC as a core reference, and the BTC and the Crypto market as a sample, to systematically analyse the Crypto cycle for similar but unique life-cycle evolutionary pathways. These pathways reflect both the common pattern of human speculation and the marked differences due to the decentrization of the block chains, the global instantaneous nature of the currency economy. After bubbles, there are always tracks that remain as the basis for the new cycle, others that have been phased out and others that have completed the transition — which is the core feature of the Crypto cycle。
On 22 May 2010, a programmer named Laszlo Hanyecz issued an invitation to exchange 10,000 bitcoins for two Papa John's pizzas at the Bitcoin Talk Forum. The deal was finally reached, and he became the first person in history to buy real goods in bitcoin. At that time, 10,000 BTCs were worth only about $41, and now they are worth more than $1 billion. The event, which was forever commemorated as “Bitcoin Pizza Day”, vividly recorded the dramatic transformation of the BTC from almost worthless technological experiments to what global institutions now regard as core assets。
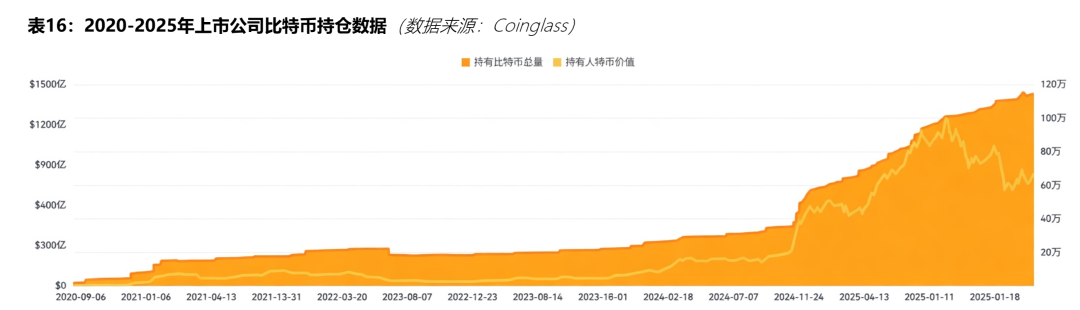
According to the data, the market value growth rate per round declined gradually from about 88 times in 2013, while the rate of collapse fell from 93 per cent to about 47-48 per cent in the 2024-2025 cycle (data as of March 2026). Behind this trend is the continued separation of the BTC from the Altcoin cycle: BTC dominance remained stable at 58.6 per cent in 2025-2026, and cumulative net inflows to the United States of America have exceeded $55 billion since approval in 2024 (the contribution of products such as BlackRock IBIT is prominent)。
This figure not only goes far beyond any single encryption product in history, but also directly reflects the fact that the BTC has been seen by the agency as a stand-alone configuration object, rather than a subsidiary of Altcoin. By contrast, the Crypto market as a whole remains highly speculative:In the early days of the cattle market, new narrative density and structural opportunities were higher; later homogenization projects surged and liquidity was significantly diluted。
The vast majority of Altcoin projects move quickly towards death or a chronic exit after the completion of the cattle market, mainly because of the lack of real users and products, rapid testimony of narratives and the continued depletion of liquidity following the sharp decline in the price of tokens. This pattern was most evident in the Terra-Luna incident in 2022: LUNA had a market value of $40 billion, the core narrative “calculations stabilization currency” had been false in a few days after the UST anchoring, and the market value had been zero in just a few days; the chain data showed that its TVL had fallen from a peak of $18 billion to less than $10 million, after which its liquidity had been depleted for a long time and no substantive users had recovered. According to DefiLlama's historical records, more than 70 per cent of DeFi and Meme projects fell by more than 90 per cent between 2021 and 2025, and most projects entered a chronic death phase after price destruction — a continuing decline in trade, a stagnation in developers' activities and, ultimately, the total oblivion of markets。
FROM THE VALUE OF 0 TO $13.6 TRILLION, TO SIMPLY COMBING THE EVOLUTION OF BTC, WE CAN ALSO HAVE A MORE INTUITIVE SENSE OF HOW ITS CONSENSUS VALUES EVOLVE:
Unique foam mechanisms: decentrization speculation, expansion of the currency economy and network effects
Cripto foams are formed in the same way as Internet foams, but their performance varies somewhat. The latter is driven mainly by VC, which is amplified through decentralised speculation, token economies and network effects. An example of this is the ICO boom in 2017, which raised approximately $5.3 billion for the whole year, with a large number of projects funded on the basis of white papers alone, with a failure rate of 46-59 per cent。
During macro-water discharges in 2020-2022, stable currency supply increased rapidly from about $5 billion to over $150 billion (stabilized in 2026 at about $310 billion), further boosting leverage and speculation. Once external liquidity has receded, the problems of a currency economy that lacks self-cyclical mechanisms are exposed: high inflation designs and short-term incentives are dominated and depend essentially on sustained external capital injection。
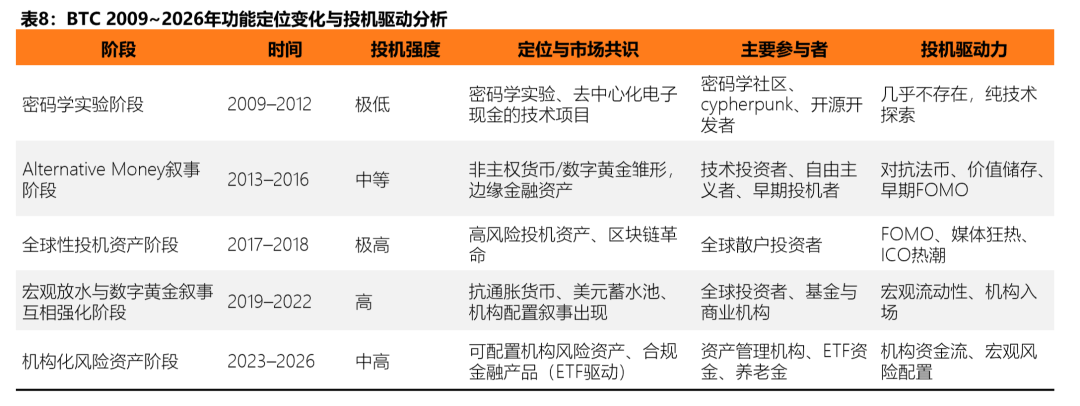
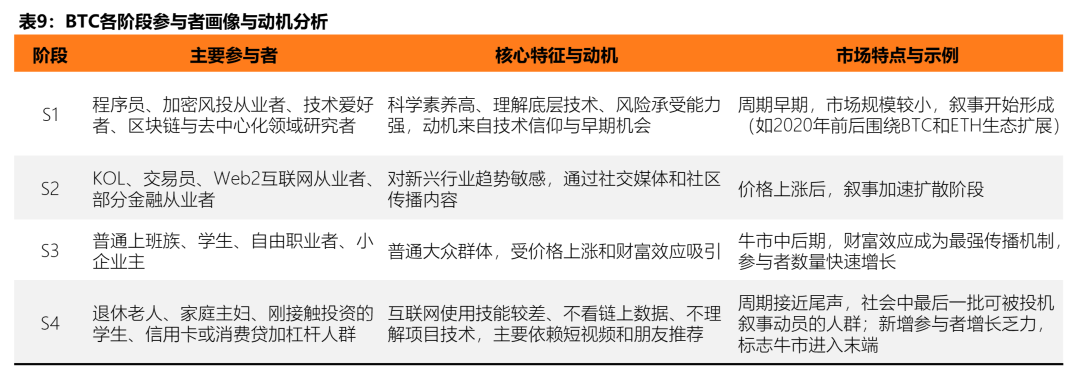
The core process of this round of Altcoin markets can be explained by the innovation diffusion theory (S curve) presented by Everett Rogers. The bull market is essentially a process of speculative narratives spreading from the early groups to society: initially driven by innovators such as programmers, encrypted VCs and technologists, who enter on the basis of their technical beliefs; then KOL, traders and Web2 practitioners, who, as early adopters, magnify narratives through social media into phenomenon-class topics; after entering the popular stage, ordinary workers, students and small business owners are attracted to wealth effects and enter the field on a large scale; and lastly lagers — people with low Internet skills, who rely mainly on short video referrals and who are easy to leverage — become final players. When adoption rates are close to 80-90 per cent, the number of new participants is significantly reduced, marginal purchases are depleted and the cattle market comes to an end. This process featured prominently in the Solana Meme season in 2024, with more than 5,000 new tokens issued in a single month, resulting in a severe diversion of attention and funds from the same track, with most of the projects trading zero in months。
When narratives spread to the end of society and early funds began to deliver profits, the upper structure of prices collapsed and the bull market ended。From a market behavioral point of view, social groups that can be mobilized by speculative narratives have largely been absorbed to represent the beginning of the end of prosperity。
Cycle and cycle: resolution of the gap between Internet foam and Crystal foam
Among the Internet foams, the NASDAQ composite index market gain peaked at about 200 times in March 2000, and a large number of technology companies were unable to calculate even a meaningful P/E (deficit over 50 per cent); the median distribution rate (P/S) was as high as 32.44 times higher in the “Internet content” plate, and Crypto, whose valuation foams were more straightforward through the TVL/market value and fully diluted valuation (FDV):
DeFi TVL peaked at about $180 billion in 2021, while the total Crypto market value for the same period was close to $3 trillion, and the FDV/TVL ratio for some Meme and emerging projects was once more than 100 times. During 2021-2025, more than 70 per cent of the Altcoin projects maintained high FDV after a significant decline in TVL, leading to a collective failure of the valuation system, well above the degree of fragmentation of the rate of Internet-era burning。
If we want to break down the causes of their differences, from the structure of market participants to macro factors, we may find some clues and clues。
Fundamental differences in participants ' structures: grass-roots victory
Internet bubbles are dominated by institutions, VCs and investment banks, with dispersed households participating mainly indirectly through stock markets and capital leading markets. By contrast, thanks to its decentrized bottom-up thinking, Crypto was more directly dominated by the global diaspora, with the number of new sites in 2021 cattle markets increasing by tens of millions, and participants rapidly spreading from technocrats to the end of society。
This structural difference directly magnifies volatility:The higher usage of bulk leverage (over 60 per cent per cent per year in the case of long-term contracts) led to the impact of the black swan incident far beyond the institutional buffer of the Internet era。The typical case is the 2022 FTX crash, with a market-wide leverage settlement of over $20 billion, and the Altcoin plate generally falling by over 60 per cent a month。
The devastating impact of macroeconomic austerity policies
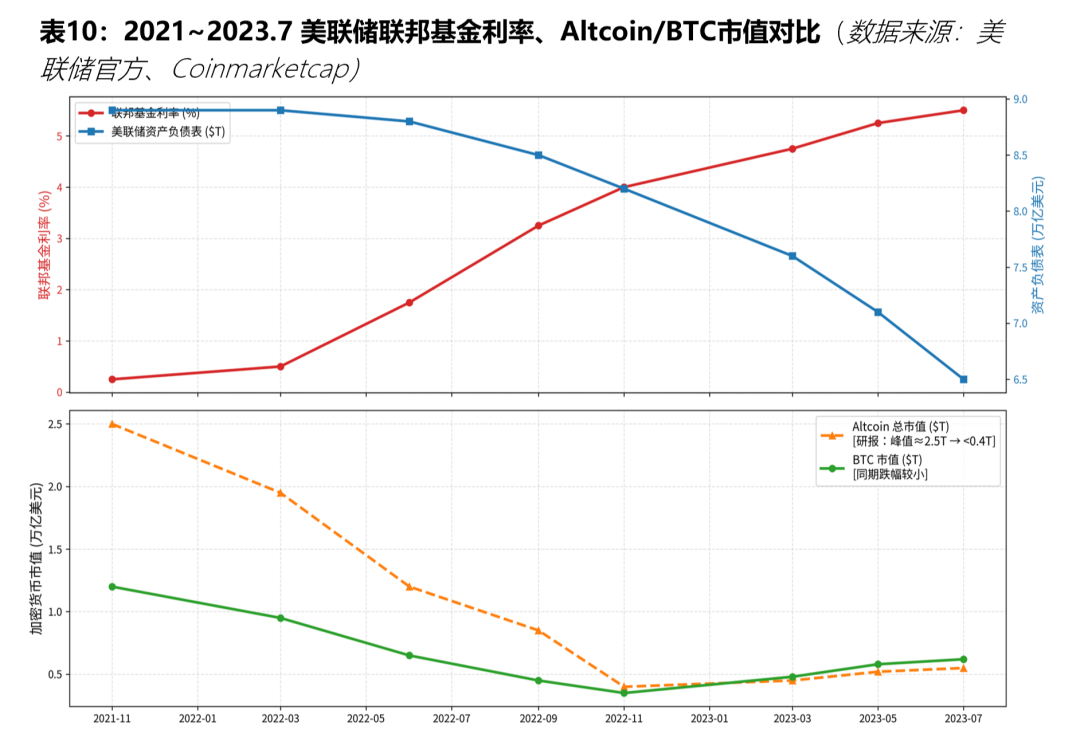
The Fed’s austerity cycle is the end of two rounds of bubbles, but the attack on Crypto is more rapid and thorough. In the Internet era, in 1999-2000, the Fed raised interest rates six times (from 4.75 per cent to 6.5 per cent for federal funds) to a collapse of NASDAQ by 78 per cent, while Crypto faced the most radical contraction in 2022: Federal Fund interest rates jumped from 0 per cent to 5.25-5.50 per cent (cumulative 525bp) and QT was launched over the same period, with a cumulative passive withdrawal of about 2.4 trillion dollars in liquidity (from 8.9 trillion to 6.5 trillion in balance sheets). The interest rate hike directly raises the opportunity cost of speculative assets, while the contraction continues to draw on the pool in the dry chain. Altcoin, a highly leveraged and fully liquid country, was the first to suffer, with the total market value falling from a peak of about $2.5 trillion to less than $40 billion, well above the BTC decline over the same period。
The chain reaction of the black swan to the flow of mobility
Crypto ' s unique global instantaneous and trans-chain properties allow for the diversion of black swans from internal mobility into double amplifiers. In the Internet bubble, external shocks (e.g. MicroStrategy recapitulated in 2000) mainly affect single plates; Cripto triggered a chain chain reaction after the FTX event: Leverage Clearing Falls+ Equivalent Narrative Project is fast on the market (in 2024 Solana had over 5,000 new currency for a single month), resulting in severe dilution of the same track funds and chronic death after a collapse of trade. The bear market data for 2022-2023 show that the volume of Altcoin transactions contracted by more than 85 per cent over peaks, and that the continued low level of developer activity (GitHub submission) further validated the systematic transfer of depleted liquidity。
The mobile evolution of the Crypto foam
The exponential growth in the distribution of tokens in the encrypted market directly diluted overall liquidity and made speculative bubbles unsustainable. According to CoinGecko co-founder Bobby Ong, the platform currently tracks 209 chains, 1450 DEXs and nearly 5.5 million tokens, and the speed at which new tokens are being created is alarming。
He predicted that, if the current trend were to evolve, the market could receive about 1 billion new coins over the next five years. This proliferation stems from the widespread availability of low-threshold tools, such as the “pump.fun platform” on Solana, which allows users to create tokens at very low cost without permission in a few seconds. This astronomical digit confirms that such a mechanism would greatly sap the liquidity of any meme: limited speculative funds are being attracted by new projects and cannot be concentrated at a single target to create prosperity。
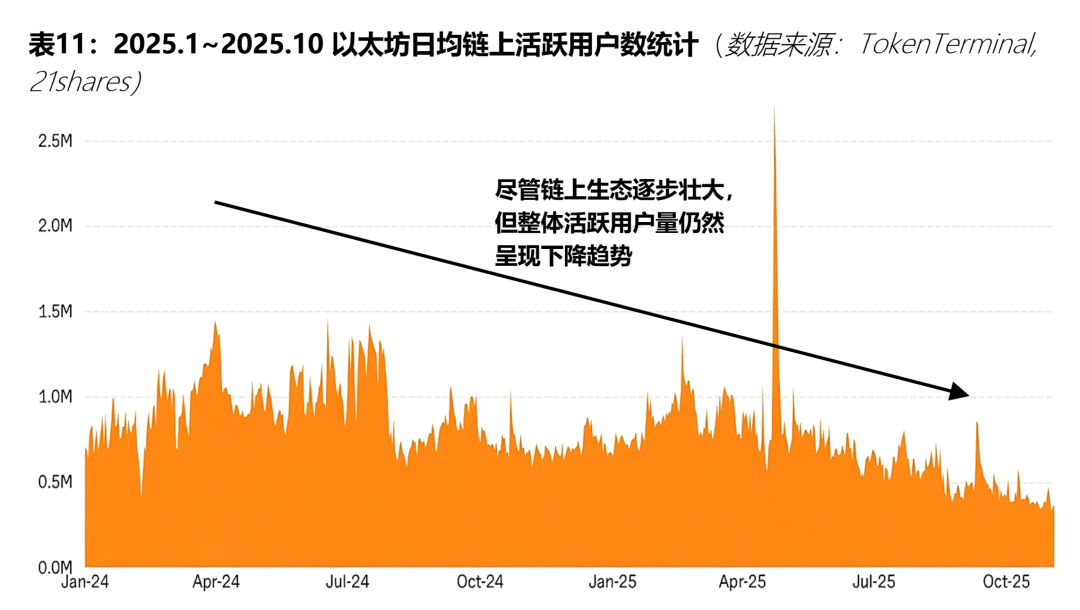
This dilution effect is further confirmed by chain data. The State of Crypto-Market Outlook 2026 report of 21 Shares a year ago showed that by the end of 2025, L2 activity had declined by 61 per cent, and the vast majority of L2 ecology had become a “zombie chain”, only Base earned $55 million, while other losses had fallen. This reflects the diversion of the proliferation of new projects: speculative funds flow from old projects to new hot spots, leading to a reduction in the size of the bubble, which is expected to decrease and eventually accelerate decline。
The vast majority of projects lack stable independent cash flow support - even if a small number of projects occasionally generate income, there are few mechanisms that can directly and efficiently assign these gains to token value (e.g., through buy-back, burn-out or dividends). In this environment, the competitiveness of projects depends almost entirely on the uniqueness and attractiveness of narratives, rather than the sustainability of the bottom economic model。
Thus, in a highly speculative market structure: narrative itself is a core asset that attracts attention and liquidity。It is difficult to create a “downside blow” between projects in the same narrative tracks, but there is a lack of differentiated value capture mechanisms and product technological advantages. This has led to the repeated diversion of speculative funds among multiple competitors and the failure to achieve sustained capital concentration. The result is fragmentation of liquidity: attention is diluted, narrative fatigue is rapidly accumulating, and investors are expected to decline, eventually triggering a massive withdrawal of funds and driving the entire track from prosperity to decline。
In the encrypted market, a new narrative often follows a similar development path:

This is particularly evident in the case of the “pump.fun” mechanism on Etheleum L2 and Solana。
First, look at L2 narratives: the Rollup-centric route proposed by Vitalik Buterin around Etheum expansion lays the groundwork for narratives, with the main chain responsible for security and settlement, and L2 for implementation. L2 Narratives attracted considerable attention at the outset and contributed to the prosperity of the track. However, narratives are highly homogenous — projects such as Optimism, Arbitrum and ZkSync all focus on expanding and reducing costs, and there is no real moat, and speculative funds naturally continue to divert. Optimism OP Stack further magnifies the problem: This modular structure has lowered the threshold of the chain, allowing developers to quickly and efficiently release a new L2, the boom of the track and the lowering of the technical threshold, and the emergence of a single L2, such as a spring after the rain, has resulted in an increase in the L2 quantitative index (articles 1-2 in 2019, 2 in 2020, 4 in 2021, 10 in 2022, 30 in 2023, 70 in 2024, 140 in 2025). By the end of 2025, there were 101 active L2s in Ethe-reum, and the fragmentation of liquidity reduced the size of the L2 token bubble in the secondary market, which moved from boom to recession. At a deeper level, however, widespread L2 can also debilitate ecological mobility along the chain, and L2 fragmentation increases financial flow resistance, exacerbates financial friction (sliding points, bridge fees, cross-ecological interactive manipulation), reduces application, development and user experience, and depletes the chain, which in turn enhances overall liquidity fragmentation. Fragmentation of the secondary market and chain of liquidity has led to fragmentation of attention, increased narrative fatigue and the withdrawal of speculators。The entire L2 track has deteriorated since June 2025, when small L2 experienced a 61% fall in TVLs, where projects like Blast crashed 97% to about $55 million, while overall L2 income fell 53% to $130 million。
Similarly, Pump.fun, as a meme currency launch platform, represents the extreme form of homogenous narratives. It simplifies the creation of tokens, allowing anyone to issue a single key, thereby boosting Solana's ecological memecoin narrative boom, 2025, doubling curve volumes in Pump.fun, rapid influx of liquidity and optimal chain conditions. But the pumpfun mechanism has caused meme coins to spread at speeds, with speculations like astronomical figures, and extreme speculative mobility has completely destroyed meme narrative tracks。
Looking back at the development history of the industry as a whole, the Crypto foam presents a clear four-stage evolution model, repeated in the years of the Silk Road 2013, 2017 ICO cycle, 2021 DeFi/NFT cycle and 2024 ETF:
- Phase I (premature):Narratives are scarce and real, early participants enter, and valuations are mildly deviating。
- Phase 2 (defunct):MACRO-LIQUIDITY AND NETWORK EFFECTS ARE RECEIVING FEEDBACK, NEW NARRATIVE DENSITY HAS SURGED, AND S CURVES COVER BOTH THE POPULATION AND THE LAGGING。
- Phase III (crash period):Austerity or black swan triggers a breakdown of confidence, prices fall sharply and extreme items fall to zero。
- Phase IV (adjustment period):MOST PROJECTS ARE CHRONICALLY OUT OF RANGE, SURVIVAL INFRASTRUCTURE HAS EXPERIENCED REVALUATION AND BTC INDEPENDENCE HAS BEEN FURTHER ENHANCED。
After all, there's nothing new under the sun。
Internet foam profiling: four repair curves after market collapse

Collapse and restoration: how the technology bubble works in the market Positive
The collapse of the foam is also the beginning of a long process of repair. After the collapse of the Internet bubble in 2000, macroeconomic markets did not rebound as quickly as partially optimistic would have been possible, but went through a multilayered, non-linear process of repair that lasted for almost seven years: monetary policy took the lead, financial markets followed, the real economy slowed back and capital confidence was finally rebuilt. These four restoration curves have varied speeds and rhythms, and have worked together to outline how macro-markets can gradually recover to the full path of past levels。
Understanding this path of repair cannot be satisfied only with the conclusion that the market eventually rose back, but rather with the question: How slow is it to return? How much did it cost to get back? And what forces drive this process
This section will provide a macro perspective, systematize the entire process of market restoration following the 2000 Internet bubble crash, supported by core data。
Scale of collapse: how deep is the starting point for repair
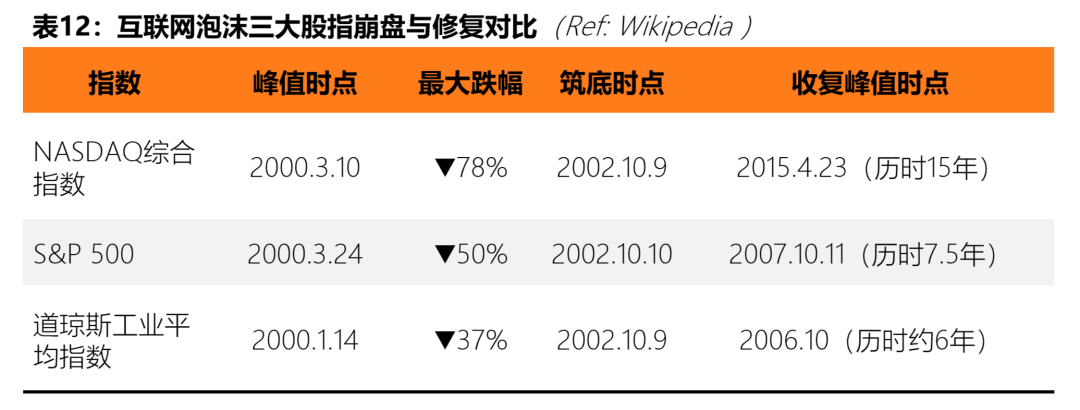
TO UNDERSTAND THE DIFFICULTY OF REPAIRING, AN OBJECTIVE LOOK AT THE DEPTH OF THE CRASH IS REQUIRED. IN TERMS OF MARKET DATA, THE SCALE OF THE DESTRUCTION OF THE TECHNOLOGY ASSETS WAS ONE OF THE WORST IN THE HISTORY OF THE UNITED STATES. BASED ON EQUITY-BASED PERFORMANCE, FROM ITS PEAK IN MARCH 2000 TO THE END OF OCTOBER 2002, THE NASDAQ COMPOSITE INDEX DROPPED SHARPLY FROM 5,048.62 POINTS TO 1,114 POINTS, A DROP OF 78 PER CENT, ALMOST ENTIRELY ELIMINATING THE FULL INCREASE ACCUMULATED DURING THE FOAM PERIOD SINCE 1995. THE PS 500 INDEX FELL FROM A HISTORICAL HIGH OF 1,552.87 POINTS TO 768.83 POINTS DURING THE SAME PERIOD, FALLING BY MORE THAN 50 PER CENT, REPRESENTING, ALTHOUGH RELATIVELY MILD, THE CONTINUED BEAR MARKET FOR MORE THAN 2.6 YEARS. BY CONTRAST, THE DOW JONES INDUSTRY AVERAGE INDEX IS THE FASTEST OF THE THREE INDICES TO RECOVER, WITH THE LARGEST WITHDRAWAL OF 37 PER CENT DUE TO THE LOW TECHNOLOGICAL CONTENT OF THE COMPONENTS。
First fixture curve: a rapid shift in monetary policy (2001-2004)
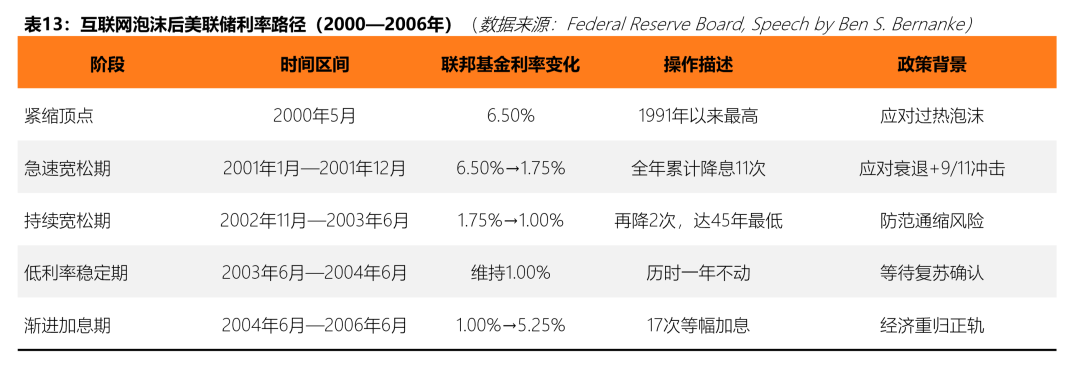
After the official burst of the bubble, the Fed was the first macro-power to respond. At the beginning of 2001, in the face of the impact of the stock market crash, the collapse of corporate investment and the subsequent 9/11 terrorist attacks, the Federal Reserve reduced interest rates cumulatively 11 times throughout the year, significantly lowering federal fund interest rates from 6.50 per cent to 1.75 per cent. This is one of the most intensive interest-rate reductions in US currency history。
Between 2002 and 2003, the Federal Reserve continued to ease in the context of a jobless recovery, with interest rates falling twice, and in June 2003 it set interest rates at 1.0 per cent - This is the lowest point in 45 years and remains at this level for an entire year. According to an official Federal Reserve study, the central logic of this round of easing is that, although the recession, as determined by NBER, ended in November 2001, the recovery of employment markets and business investment has been very slow, with substantial economic recovery lagging behind。
IN JUNE 2004, AS GDP ACCELERATED AND UNEMPLOYMENT STARTED TO DECLINE, THE FED BEGAN TO INCREASE INTEREST RATES GRADUALLY AT 25 BASIS POINTS PER TRIP, 17 TIMES BETWEEN 2004 AND 2006, RECOVERING INTEREST RATES FROM 1.0 PER CENT TO 5.25 PER CENT, AND COMPLETING MONETARY POLICY RETURN FROM EXTREME EASING TO NORMALIZATION。
The above path illustrates the core features of monetary policy operations in the post-fame era: rapid easing to the bottom, long-term low interest rates to catalyse, and gradual tightening to regulate。
Second restoration curve: Gradient rehabilitation of the real economy (2001-2006)
UNLIKE THE RAPID SHIFT IN MONETARY POLICY, THE REHABILITATION OF THE REAL ECONOMY IS A PROCESS THAT IS CLEARLY BEHIND SCHEDULE AND AT A SLOWER PACE, AS EVIDENCED BY THE STRATIFICATION OF GDP AND EMPLOYMENT。
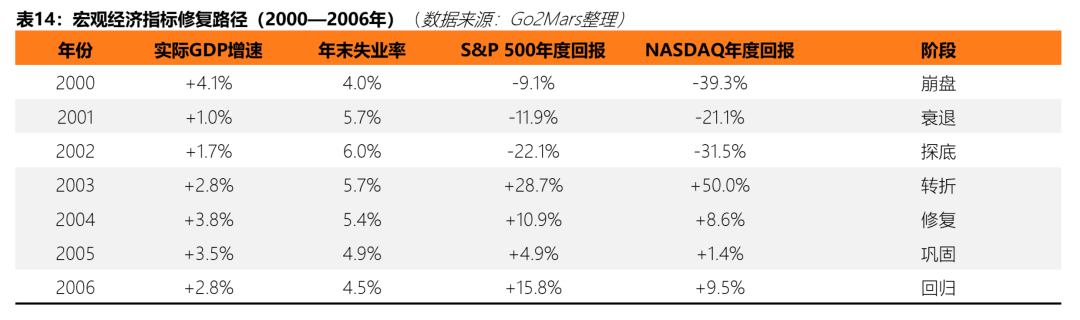
GDP LEVEL: SHALLOW RECESSION AND GRADUAL RECOVERY. NBER DEFINED THE MONTH OF MARCH TO NOVEMBER 2001 AS AN ECONOMIC DOWNTURN LASTING ONLY EIGHT MONTHS, ONE OF THE RELATIVELY SHORT RECESSIONS IN POST-WAR HISTORY. ACCORDING TO BEA DATA, REAL GDP GROWTH IN 2001 WAS ONLY +1.0 PER CENT, WELL BELOW THE PREVIOUS HIGH-SPEED EXPANSION (+4.8 PER CENT IN 1999), BUT DID NOT SHOW NEGATIVE GROWTH; IN 2002, CONSUMER SPENDING AND HOUSING EXPENDITURE ROSE AGAIN TO +1.7 PER CENT, FOLLOWED BY A SIGNIFICANT ACCELERATION OF GDP GROWTH TO +2.8 PER CENT IN 2003 AND A MORE COMPLETE YEAR-BY-YEAR RECOVERY PATTERN OF +3.8 PER CENT AT THE PEAK OF THE POST-FOAM ERA IN 2004。
Employment market level: A significant lag in GDP. Employment data are the most lagging and costly curve of the round. The unemployment rate in the United States continued to climb from a historical low of 4.0 per cent in September-October 2000 to a peak of 6.3 per cent in June 2003 — more than a year and a half after the perceived end of the recession. This unusual pattern of “recession is over and unemployment continues to rise” is referred to by economists as “jobless recovery”. Data from the United States Department of Labor show a net reduction of about 17.35 million jobs in 2001 alone, and about 58,000 in 2002. The scientific and technological industry has borne the brunt, and it is estimated that between 2001 and mid-2003 the Silicon Valley region lost about 200,000 jobs alone. The unemployment rate had largely recovered to near 2000 levels at the end of 2006 (the unemployment rate fell to 4.4-4.5 per cent) and the entire employment rehabilitation cycle lasted more than six years。
Third restoration curve: stratification of capital markets (2002-2015)
UNLIKE THE RELATIVE LINEAR REHABILITATION OF THE REAL ECONOMY, THE REHABILITATION OF CAPITAL MARKETS IS CHARACTERIZED BY A MORE COMPLEX STRATIFICATION: THE OPEN MARKET, REPRESENTED BY THE STOCK MARKET, HAS BEEN THE FIRST TO RECOVER, WHILE THE PRIVATE CAPITAL MARKET, REPRESENTED BY THE VC AND IPO, IS LAGGING MORE SIGNIFICANTLY AND THE PATH OF REHABILITATION IS INCOMPLETE。
Open Markets: Rapid technical rebound, but full recovery of lost land takes a long time. As can be seen from the table below, in October 2002 the market began to enter the technical rebound phase following the simultaneous construction of the base. S& P500 recorded strong returns of +28.7 per cent for the whole of 2003, followed by a steady increase (+10.9 per cent in 2004 and +4.9 per cent in 2005 and +15.8 per cent in 2006), but several years of positive returns continued to accumulate, driving the index to reach its peak in 2000 in October 2007 and to recover the total amount of land lost in about 7.5 years. By contrast, the process of repairing NASDAQ was longer: because of the overall deviation of its component shares during the foam period, which was much higher than S& and because of the P 500, the index did not finally recover the 5,048 points of historical recovery on March 10, 2000, which lasted for 15 years, and was interrupted by the 2008 financial crisis。
IT IS WORTH NOTING THAT ALTHOUGH NASDAQ FULLY RECOVERED THE LOST LAND FOR 15 YEARS, FROM THE END OF OCTOBER 2002 TO 2007, THE INDEX HAS RISEN FROM 1,114 POINTS TO OVER 2,800 POINTS, WITH AN INCREASE OF NEARLY 150 PER CENT. IN OTHER WORDS, FOR INVESTORS ENTERING AT THE BOTTOM, THIS IS AN EXCELLENT REVERSE LAYOUT WINDOW, BUT FOR LONG-TERM INVESTORS HOLDING TECHNOLOGY SHARES NEAR PEAKS, THE WAITING COST OF REPAIR IS MEASURED IN 10 YEARS。
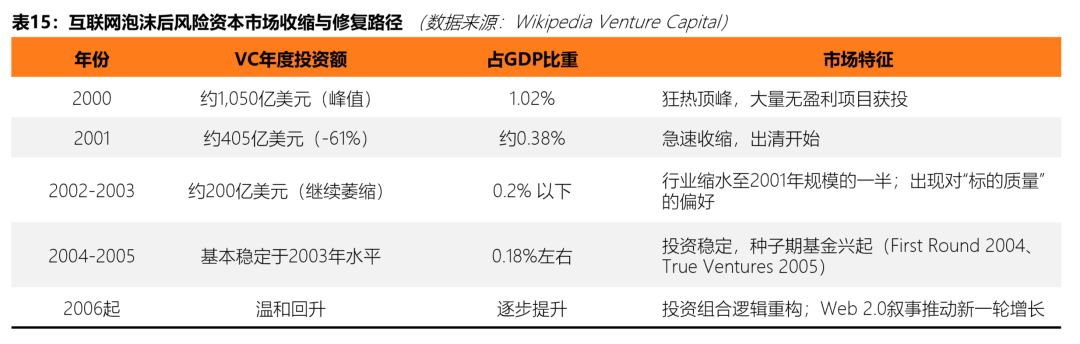
Risk capital markets: severe contraction and very slow recovery. The path to repairing the VC market is more distorted than the open market. At the peak of the bubble, VC annual investment in the United States was approximately $105 billion, or 1.087 per cent of GDP (PricewaterhouseCoopers MoneyTree Survey data). After the collapse, VC funds retreated at a much faster rate than expected: investment fell sharply in 2001 to about $40.5 billion, and in 2002-2003 the industry as a whole contracted to about half its 2001 level, and VC investment as a percentage of GDP was reduced to less than 0.2 per cent, less than one fifth of the peak of the bubble。
VC ecological microstructures have also undergone fundamental restructuring at this stage. The business model that prevailed during the bubble era, “growth first, profit second”, was questioned, and investors began to move systematically to higher quality targets - - More mature companies, clearer profit paths, lower valuation multipliers have become new screening criteria. Wing VC data show that the median age of companies completing round A financing increased from 0.5 years in 2000 to 1.4 years in 2003, an indicator that intuitively reflects a systematic decrease in investor tolerance for the risks of start-up projects. At the same time, new seeding institutions such as Y Combinator (2005) and FirstRund Capital (2004) emerged during this period, completing the VC ecological metabolism from institutional structures。
THE FREEZING OF THE IPO MARKET WAS ALSO A PROMINENT FEATURE OF THIS PERIOD. IN 2000, WHEN THE FOAM WAS TAILING, 380 COMPANIES WERE STILL ON THE MARKET; IN 2001, AFTER THE FOAM BURST, THE NUMBER DROPPED SHARPLY TO 79, LESS THAN A QUARTER OF THE PREVIOUS YEAR. THE CLOSURE OF THE EXIT WINDOW HAS DIRECTLY SUPPRESSED THE ENTIRE ECOLOGICAL FLOW, AND VC INSTITUTIONS HAVE BEEN CAUGHT UP IN THE "SUSTAINLESS" SITUATION, FURTHER EXACERBATING THE CAUTIOUSNESS OF NEW INVESTMENTS. THIS EXIT WINDOW WILL BE SUBSTANTIALLY RESTARTED UNTIL 2004 - 2005。
Article 4 Rehabilitation Curve: Reconstruction of Regulatory Framework and Restoration of Trust (2002-2004)
Market restoration takes place not only at the valuation and financial levels, but also in the rebuilding of institutions and trust. During the Internet bubble, a large number of companies were exposed to financial fraud (e.g. Enron exploded in October 2001, Chase WorldCom in June 2002 and Adolphia in June 2002), seriously undermining public trust in capital markets. The stock market continued to decline in 2002, partly as a result of successive accounting scandals that rebuffed investor confidence。
On 30 July 2002, the United States Congress formally passed the Sarbanes-Oxley Act, SOX, the most important regulatory reform of the United States securities market since the Great Depression. The SOX Act significantly strengthens the internal control requirements of open companies, increases the legal responsibility for financial certification of executives and imposes new restrictions on the independence of external audit bodies. The introduction of this legislation marked the beginning of the re-establishment of the market order at the regulatory level and provided the institutional basis for the subsequent return of investor confidence。
AT THE SAME TIME, THE SEC IMPOSED SUBSTANTIAL FINES FOR CONFLICTS OF INTEREST ON LARGE INVESTMENT BANKS SUCH AS CITIGROUP AND MERLIN, AND PROMOTED STRUCTURAL REFORMS IN THE INDEPENDENCE OF ANALYSTS. THESE SYSTEMIC MEASURES OF INSTITUTIONAL REHABILITATION, COMBINED WITH MONETARY POLICY EASING AND IMPROVED ECONOMIC DATA, FORM AN INTEGRAL BASIS FOR REBUILDING MARKET CONFIDENCE。
Macro laws of the path: five core conclusions
Combining the data analysis of the four above-mentioned repair curves, the process of repairing macro-markets after the Internet bubble revealed the following regular findings that deserve attention:
First, monetary policy is the fastest and most powerful lever in the rehabilitation process, but it can be reduced mainly by the bottom-up of financial markets, and the transmission of employment and real investment still lags significantly — in this round, unemployment peaks almost two years behind the end of the recession。
SECOND, THERE ARE SYSTEMIC DIFFERENCES IN THE SPEED OF REHABILITATION IN DIFFERENT MARKETS: OPEN MARKETS (EQUITY MARKETS) ARE THE FASTEST HIT, GDP IS SECOND, EMPLOYMENT IS THE SLOWEST TO RECOVER, AND VC AND PRIVATE CAPITAL MARKETS TEND TO EXHIBIT TYPICAL EXCESSES — WHEN FUNDS WITHDRAW, THE RECONSTRUCTION CYCLE WILL WELL EXCEED THE REASONABLE TIME INDICATED BY THE COLLAPSE ITSELF。
Third, there is a significant time lag between the index's “formal return” and the “substantive return”. S& P500 strongly rebounded in 2003 + 28.7%, but its peak recovered after 7.5 years; NASDAQ lasted even 15 years. This means that the real cycle of repair is much longer for investors in high-profile configurations than the rebound shown on the K-line。
FOURTH, POST-FOAM MARKET REPAIR IS OFTEN ACCOMPANIED BY A FUNDAMENTAL RESTRUCTURING OF ECOLOGICAL STRUCTURES: VALUATION LOGIC SHIFTS FROM “USER GROWTH” TO “PROFITABILITY”, VC MOVES FROM “SPREAD-NET LAYOUT” TO “SELECTED MATURE PROJECTS”, AND REGULATORY FRAMEWORK MOVES FROM “BACK-TO-BACK ACCOUNTABILITY” TO “SYSTEMIC CONSTRAINTS”. THE REPAIRS WERE NOT ONLY ACCOMPANIED BY A RETURN IN PRICES, BUT ALSO UPDATED THE MINDSET OF PARTICIPANTS AT THE MARKET LEVEL AS A WHOLE。
FIFTH, ABOVE THE COLLAPSE, TECHNOLOGY COMPANIES WITH REAL INFRASTRUCTURE VALUE NOT ONLY SURVIVE, BUT BECOME THE CORE ENGINE OF THE NEXT GROWTH CYCLE. AMAZON'S SHARE PRICE IN THE BUBBLE FELL FROM $107 TO $6, AND IT WAS DURING THIS PERIOD THAT IT COMPLETED THE STRATEGIC TRANSITION FROM ELECTRICIAN TO CLOUD COMPUTING (AWS BUD), LAYING THE FOUNDATIONS FOR ITS EXPLOSIVE GROWTH IN THE NEXT DECADE — THE MOST PREDICTABLE HISTORICAL REVELATION OF THE FOAM RECOVERY PHASE。
Crypto: Guidance on future trends, patterns and strategies

Periodic positioning: where is Crypto at
As of March 2026, the total market value of the global encryption market was approximately $2.5 trillion, Bitcoin prices were organized between $65,000 and $76,000, and Bitcoin dominance stabilized at about 58-60 per cent. This situation is highly structurally similar to the fourth phase — the adjustment period — following the collapse of the Internet bubble described above. Markets have returned from speculative carnivals, but not from where they started, but from a more mature foundation. Based on the data and frameworks of the first three sections, this chapter will map the current realities of the cycle to the Cripto market and make strategic recommendations for project, VC and investors。
If the four-stage model described above were to be applied to the current Crypto market, the market position in Q2 in 2026 would be closer to the transition to the “adjusting period” of a new bud. This judgement is based on the following core elements。
In terms of the monetary policy dimension, the Federal Reserve has maintained federal fund interest rates at 3.5 to 3.75 per cent of the target range at two consecutive meetings in January and March 2026, with the latest FOMC point-forming chart showing only one expected interest rate reduction in 2026. Meanwhile, the energy price shock caused by the Iranian war has re-emerged the risk of inflation, and the Chairman of the Cleveland Federal Reserve, Beth Hammack, warned in April 2026 that if inflation continued to be high, the possibility of a new hike would not be ruled out. This means that the current macro environment is at the end of an austerity cycle but has not yet entered a phase of clear easing. This is in contrast to the situation in 2001-2003 after the collapse of the Internet bubble, when the Federal Reserve had lowered interest rates to 1 per cent after 13 interest cuts and the market had rebounded in an extremely liberal environment. The Crypto market, however, is still organized in an environment where interest rates remain above 3.5 per cent, suggesting that it is not yet fully supported by monetary policy。
In terms of the dimensions of ETF and institutional funding, the United States cash Bitcoin ETF has surpassed the cumulative net inflow of $53 billion since its approval in January 2024, well above the most optimistic expectations of analysts before their products go online. The current spot AUM of Bitcoin ETF is in the range of $90-100 billion, and the iShares Bitcoin Trust (IBIT) of BlackRock alone represents over 45 per cent of the market. This trend suggests that Bitcoin has begun to shift from speculative assets to agency-level configuration targets, with multiple-calibre investors now accounting for over 30 per cent of all available BTC ETF holdings。
In terms of the structure of the capital market, the Crypto VC market is undergoing a structural adjustment that is highly similar to the VC market after the Internet bubble. According to The Block data, total risk investment in the Crypto area in 2025 was approximately $18.9 billion (traditional windfall component, excluding DAT), up from $13.8 billion in 2024, but the volume of transactions decreased by about 60 per cent over the same period, from more than 2900 in 2024 to about 1,200. Capital is highly concentrated in a few later projects, and early entrepreneurs are experiencing the most difficult financing environment in many years. This is similar to the “quality migration” in the VC industry in 2002-2004 after the Internet bubble - in 2000, at the peak of the bubble, the median age of companies completing round A finance was only 0.5 years, and by 2003 it had grown to 1.4 years - a systematic reduction in the risk tolerance of investors to early projects。
Core variable: What's the difference this time
On 17 March 2026, the United States SEC and CFTC jointly issued an explanatory document (Interpretive Release No. 33-114112) on 68 pages, officially classifying 16 major digital assets as digital commodities. The document establishes five types of currency classification: digital goods, digital collections, digital tools, stable currencies and digital securities. Only the last category is covered by the SEC, and the rest is not covered by the securities regulations。
The significance of this initiative is that it put an end to the largest regulatory uncertainty in the encryption industry for more than a decade. Previously, SEC had initiated enforcement actions against a wide range of assets, such as Solana and XRP, which had led to significant institutional funding waiting for compliance risks. This is fully in line with the role of the SOX Act of 2002 after the Internet bubble — when financial fraud scandals like Enron and World Wide Web seriously undermined market confidence, and the SOX Act re-established the institutional basis by strengthening internal control and auditing independence. The Crypto regulatory framework is completing the same function. At the same time, GENIUS Act was formally signed into law in July 2025, establishing a federal-level regulatory framework for a stable currency, while CLARITY Act was passed by 294-134 votes in the Chamber of Deputies, and the Senate Committee on Agriculture was moved forward in January 2026, pending consideration by the Senate Banking Commission。

STRATEGIC GUIDANCE: FRAMEWORK FOR ACTION BY PROJECT, VC AND INVESTORS
By supersing the repair curve after the Internet bubble with the current market structure of Crypto, some rational evolutions can be made over the next five years。
In the short term (2026-2027), the market will continue to be in the sorting and screening phase. The interest rate path of the Fed is the decisive variable:
- If interest rates begin to go down during the year, the risk assets will be clearly supported by liquidity
- The Altcoin market would face deeper clearance if it were to re-introduce inflation as a result of energy price shocks。
In the medium term (2027-2029), if the interest rate cycle normalizes and begins to enter into a liberal phase, the Crypto market is likely to enter a new growth cycle during this period. Unlike the previous cycle, however, the core driving force for this round of growth is likely to be no longer a purely speculative wave of liquidity, but rather the scale-up of RWA tokenization, the global penetration of stable currency payments and the continued inflow of institutional funds through ETF. This means that market volatility may continue to decline, but the sustainability of growth will increase significantly. As in the rehabilitation cycle following the Internet bubble, the Amazon completed a strategic transition from electrician to cloud computing during a period when stock prices fell from $107 to about $6, and a number of projects in the Crypto industry that completed product upgrading during the current adjustment period became the core engine of the next round of growth。
But it needs to be warned that the history of the Internet bubble clearly tells us that, even if the market as a whole begins to warm up, the rate of rehabilitation of different indicators varies dramatically. S& P500 rebounded strongly in 2003 +28.7%, but it took NASDAQ 15 years to return to its peak in 2000. In the Crypto world, this means that the rehabilitation of the BTC will be significantly faster than that of the vast majority of Altcoin, and that a large number of projects will not return from mere narratives in the last cycle。
Project-oriented: what kind of projects the market needs
In the current environment, there has been a profound change in the financing context of the project. A16z crypto General Partner Arianna Simpson points out that the concentration of financing in 2025 is driven mainly by the stabilization of coins and payment tracks, that the boundary between Crypto and Fintech is rapidly blurring and that traditional business models based on transaction fees and flows are replacing the old model driven by the economics of tokens。
Looking back at the history of the Internet bubble, the projects that survived its collapse and continued to grow over the next decade share a common feature: During the market adjustment period, they completed a fundamental transformation of the business model from reliance on external capital injection to self-sustaining cash flows. For Crypto projecters, this means that “compliance + institutional level” is at the core of the future, and the focus needs to be on three directions: One is the stabilization of currency and payment infrastructure, which is the most stable source of income; the second is the RWA tokenization services, including distribution platforms, hosting, compliance and secondary market transactions; and the third is the compliance institutional chain financial infrastructure, including clearing, clearing and hosting services。
Of course, it's worth mentioning that in the current wave of AI, AI will certainly become the focus of attention in all walks of life. But for Web3 projecters, it is more important to be pragmatic: If AI can truly strengthen the core product logic — improving compliance efficiency, optimizing wind control, or interacting along the enabling chain — it is worthwhile to integrate in depth; if it is just a hot patch of the "AI+Web3" concept, it may only dilute the strategic focus, which does not work substantively across cycles。
FOR VC: HOW TO TRANSITION
The Cripto VC industry is currently undergoing the same structural restructuring as the Internet bubble. According to Messari, in the past 12 months, as of March 2026, the total amount of encrypted financing had increased by about 50 per cent over the same period, but the number of transactions had fallen by 46 per cent, with the average volume of transactions having jumped from about $9 million to $34 million. The number of active investors decreased from year to year by 34.5 per cent. According to Rob Hadick, a large number of Cripto VC agencies are approaching the end of the previous deployment of the Fund and the difficulty of raising new funds has increased significantly. This situation is highly similar to the restructuring of the U.S. VC ecology in 2002-2005. At that time, new seeding institutions, such as Y Combinator (2005), First Round Capital (2004), were established during the deepest winters of the industry, completing the growth of the VC ecology。
Against this background, several key transformational directions are of concern for the current Cripto VC: First, the shift from pure currency investment to a hybrid model of equity + tokens has been mainstreamed in stabilizing currencies, payments and the RWA track; second, raising the requirement of financial health for the project to focus on real income, unit economy and customer retention rather than just TVL or address numbers; and lastly, the adjustment of geographical distribution from a focus on simply following the pace of funds in the United States market to a truly globalized layout - – In particular, emerging market countries such as Asia, Africa and Latin America are being considered at the same time。
Investor-oriented: risk identification and allocation strategy
Historical data have repeatedly demonstrated that entering the site during the adjustment period following the bursting of the foam is the window with the highest long-term return. NASDAQ increased by more than 150 per cent (approximately 155 per cent) from the bottom of October 2002. For Crypto investors, the core strategy at this stage should include the following。
First is the configuration priority for BTC. The BTC institutionalization process has become irreversible, and the existence of ETF has enabled the BTC price base to support much more than any previous cycle. By April 2026, BTC dominance had remained at 57-59 per cent, which indicates that during the overall market consolidation period, funds were still concentrated in BTC。
The second was to be extremely cautious about the Altcoin market. The foregoing analysis has amply demonstrated that the proliferation of tokens and homogenous narratives were the structural causes of the previous fall in the Altcoin market. Against the background of the 2024 Solana EcoSystems with peaks of more than 50,000 new tokens, the vast majority of Meme and narrative-driven projects have been trading zero in months. Only those Altcoin projects that have a verifiable source of income and user viscos are worthy of serious consideration at this stage。
Finally, there is continuous tracking of macro-risks. The greatest uncertainty at the moment comes from two sources: the energy price shock triggered by the Iranian conflict and its impact on inflation and monetary policy; and the change in the term of the Federal Reserve Chairman, Jerome Powell, whose term will expire on 15 May 2026, whose policy preferences will have a direct impact on the subsequent interest rate path. The history of the Internet bubble has taught us that changes in interest rates are not the result of breaking or driving markets in isolation, but are more a function of external shocks and changes in confidence. Investors should simultaneously monitor the evolution of these three variables rather than relying on either。
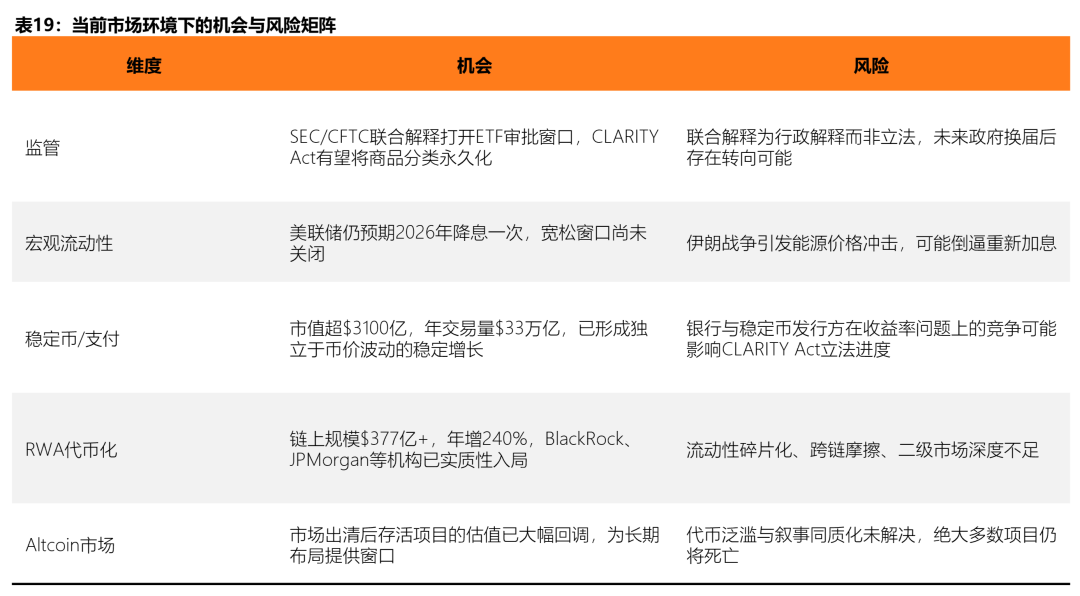
Rear
Every major technological wave in history has been retrofitted with extraordinary clarity, but hardly anyone has been able to confirm where the bottom is and when the turning point comes. This is a true picture of the current situation in the Crypto market。
In terms of structural indicators, there is a clear historical similarity between the current adjustment period and the rehabilitation phase following the collapse of the Internet bubble: capital concentration to the head, continued progress in infrastructure development, a shift from ambiguity to clarity in the regulatory framework, and a systematic entry of institutional funds. These signals also appeared on the Internet in 2002-2004, after which the next decade of sustained growth followed。
But it needs to be recognized that Cripto faces a number of unique variables that did not exist in the Internet era. The direct impact of geopolitical conflicts on energy prices and inflation paths, the continuing divergences in the regulatory position of sovereign countries over digital assets, and the continuing alienation of the AI wave from venture capital attention and resources constitute additional uncertainties beyond the framework of historical Internet analogies. These variables do not have mature historical pricing models that can be referenced, but are subject to constant tracking of dynamic adjustments。
Therefore, cautious optimism about the long-term prospects of the Crypto market is a legitimate position - – The optimism stems from structural improvements in the fundamentals and from the objective existence of these variables. Until macro-conditions are fully normalized, keeping distance from all grand narratives on "super-cycles" and focusing on verifiable data and quantifiable risks is perhaps the most pragmatic and reliable operational principle of the moment。
Human beings are a self-deceptive creature, and while we all know the answer, we need to make it clear whether it exists or is correct through various external evidence, even the affirmation or denial of others。
After the bubble, not the end, but the real beginning。
