
BITCOIN'S MULTI-SPACE GAME IS NOT OVER
THIS WEEK, THE HYPE DAYLINE V WAVE STRUCTURE IS FACING A CRITICAL SUPPORT TEST, AND THE BTC IS WAITING FOR DIRECTIONAL SELECTION IN A MULTISPACE GAME, FOCUSING ON THE PACE OF ENTRY AND OPERATIONAL STRATEGIES。

THIS WEEK, THE MARKET IS LOOKING IN THE DIRECTION OF THE SHOCK, WITH OPPORTUNITIES AND RISKS. THE HYPE SOLAR-LINE V WAVE STRUCTURE FACES A CRITICAL VALIDATION NODE, AND THE SUCCESS OR FAILURE OF $40.17 WILL DETERMINE THE WAY FORWARD; THE BTC HOVERS BETWEEN THE CONTINUATION OF THE WAVE AND THE PRESSURE ZONE OF THE D WAVE, AND THE MULTISPACED GAME BETWEEN THE $73,500 AND $79,000 ZONE REMAINS THE CENTRAL FOCUS。
Following a course of discipline, the party is able to move forward in complex situations。
A summary of the core views of the transaction this week:
• & nbsp; hype current trend structure analysis. (See Part One for further information)
• & nbsp; hype prognosis and short-line operational strategy for the week. (See Part II for further information)
• & nbsp; BTC multi-cycle structure analysis. (See Part Three for further information)
• & nbsp; BTC contingency this week and medium- and short-line operational strategies. (For further information, see Part IV) & nbsp;
Last week's trading strategy and core view market validation:
• & nbsp; hype short-term trading effectiveness: hype completed a short-line single operation (1 multiple leverage) last week, cumulatively yielding about 6.80 per cent. (See table I for details)
• & nbsp; hype movement forecast market validation: In the previous article, we pointed out that hype's rebound, which started at a low point of 34.44 on April 2nd, was a potential V-wave rise in the solar-line structure. Current market trends confirm our previous views. Last week, the highest rebound in the market reached $45.75, not only succeeded in breaking the third wave high of March 18, 43.78 dollars, but also set the current upward trend。
• & nbsp; BTC Medium Term Transaction Effectiveness Validation: Bitcoin followed the established mid-line strategy last week and continued to hold empty bills of $89,000 (one multiple leverage) for warehouse construction, with approximately 17.08 per cent profit as of last week ' s closing (approximately $73,800) and 32.58 per cent maximum profit over the period。
• & nbsp; BTC Prognosis Market: In last week's article, we said that the market will maintain an inter-zone broad band shock pattern. The current market trends confirm our assumptions。
I. HYPE: ANALYSIS OF TRENDS
HYPE 4 HOURS KLINE
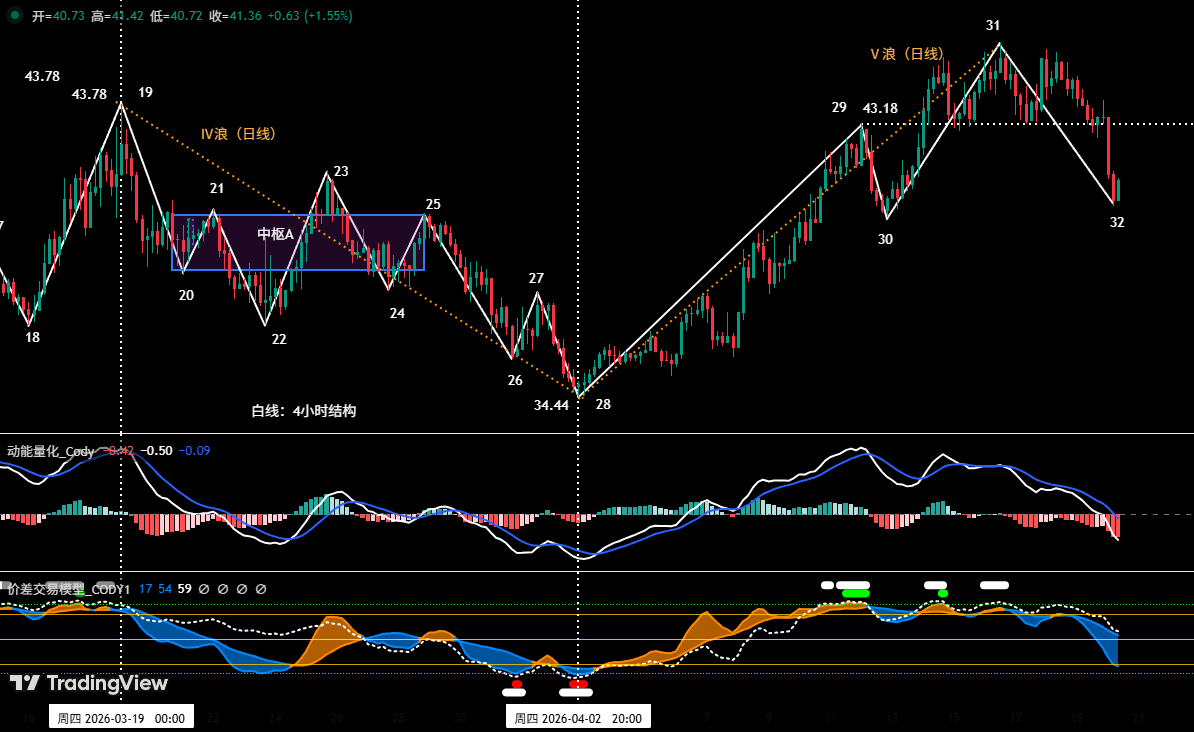
Figure I
AS SHOWN IN FIGURE I, ON APRIL 16, HYPE REACHED A NEW HIGH OF US$ 45.76, A NEW REBOUND SINCE JANUARY 21ST, AT A LOW POINT OF US$ 20.46 AND A BREAKTHROUGH OF US$ 43.78 (I.E., THE THIRD WAVE HEIGHT) BEFORE MARCH 18TH. AS A RESULT, THE UPWARD TREND OF 34.44 UNITED STATES DOLLARS, WHICH BEGAN AT A LOW POINT ON 2 APRIL, CAN BE CONSIDERED FOR THE TIME BEING AS THE RISING STRUCTURE OF THE V WAVE AT THE SOLAR-LINE LEVEL AND IS IN OPERATION。
AS SHOWN IN (FIGURE I), THE ABOVE-MENTIONED DAYLINE V WAVE CAN BE FURTHER BROKEN DOWN IN THE FOUR-HOUR CYCLE INTO AN UPWARD STRUCTURE CONSISTING OF 28-29, 29-30, 30-31, 31-32 PARAGRAPHS。
3. Current status is running 31-32 adjustments。
& nbsp; & nbsp; •nbsp; in the HYPY's 4-hour structure, our self-built kinetic energy quantification model has detected that two kinetic energy signal lines have been running simultaneously to the bottom of the zero axis, which bodes for an adjustment to this paragraph that may be extended。
& nbsp; •nbsp; •nbsp; currently the potential endpoint for adjustment (i.e. endpoint 32) is close to the pre-period support position of us$ 40.17 (i.e. endpoint 30)。
ii. HYPE Prejudication and Short Line Operations Strategy & nbsp;
ONE, HYPE, THIS WEEK'S MOVEMENT PREJUDGES:
As shown in figure IFocus on End 32 Whether to break End 30(i.e., $40.17):
• & nbsp; maintaining box concussion between us$ 40.17-45.76 if it stands firm
• & nbsp; if the supporting position is broken and the subsequent rebound height does not exceed US$ 45.76 (i.e. end 31), it constitutes a classic technological form of “regulating the low before the break, but the subsequent rebound is not innovative”. This would mean a rise in the solar-line level V wave structure, which has been activated since 2 April at a low point, with a high probability that the end has been completed at $45.76。
2-HYPE SHORT-LINE OPERATIONAL POLICY THIS WEEK:
• & nbsp; based on prediction of overall upward trends, should be followed"As you go along, you do more."The strategy。
• & nbsp; based on an autonomously constructed quantitative model signal, 30 min/60 min operational cycle, using 30% warehouse slots to capture the field for multiple opportunities。
• & nbsp; Silo Strategy: hype faced adjustment needs early this week. If the price is in the vicinity of the key support of $40.17, when the confirmation station supports the signal above, combined with the bottom of the two models, the entry may be considered and disciplined。
III. Analysis of the multi-cycle dynamics of Bitcoin
BTC DAYLINE CLASSIFICATION:(based on events after the height of October 6, 2025)
BITCOIN DAY K LINE:
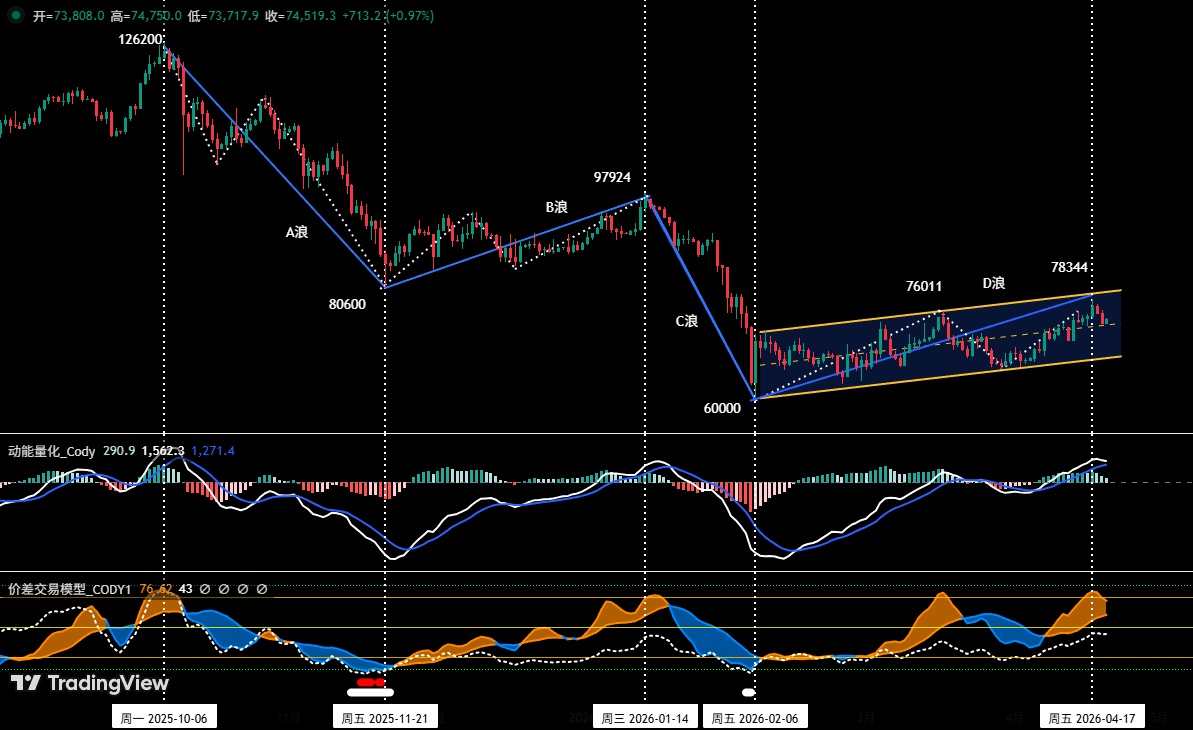
Figure II
AS SHOWN IN FIGURE II, AS A RESULT OF THE REBOUND OF BITCOIN, WHICH STARTED AT A LOW POINT OF $60,000 ON 6 FEBRUARY, NOT ONLY ON 17 APRIL, WHICH WAS AT A NEW HIGH OF $78,333 BUT ALSO ON 19 APRIL, WHICH HAD BEEN IN OPERATION FOR APPROXIMATELY 73 TRADING DAYS, ITS TIME AND SPACE HAD SIGNIFICANTLY EXCEEDED THE PREVIOUSLY PREDETERMINED “C-WAVE-ADJUSTED WAVE-INSIDE C-2 REBOUND” (E.G., ITS CONTINUOUS REBOUND HAD EXCEEDED 54 DAYS BY FAR)。THEREFORE, THE ORIGINAL FRAMEWORK MAY NEED TO BE ADJUSTED FROM THE POINT OF VIEW OF THE PRINCIPLES OF WAVE THEORY AND ANALYSIS. WE ARE MORE INCLINED TO DEFINE THIS ROUND AS A LARGER “D-WAVE REBOUND”, STARTING WITH $60,000, WHICH IS MORE IN LINE WITH THE OBJECTIVE FACT THAT THE CURRENT MARKET IS MOVING IN SPACE FOR LONGER PERIODS OF TIME。
Specific medium-term adjustment wave classification could be optimized as follows:
• & nbsp; A wave adjustment (driving down): Started at the height of $126,200 on 6 October 2025, and ended at the low of $80,600 on 21 November 2025, with a maximum drop of about 36 per cent for approximately 46 days. The wave established medium-term adjustment patterns。
• & nbsp; B Wave Reversal (complex adjustment): Started at a low point of $80,600 on 21 November 2025 and ended at a high point of $97,924 on 14 January 2026, lasting approximately 54 days, with a maximum increase of 21.5 per cent. This is an amendment for the fall of the A wave。
• & nbsp; C Wave Adjustment (Main Falling): Started on 14 January 2026, at a height of US$ 97,924 and reached a low of US$ 60,000 on 6 February 2026, with a maximum fall of about 38.7 per cent, over a period of approximately 22 days. The wave completed the main space component of the adjustment。
• & nbsp; D Wave rebound (currently ongoing/probably not in progress): Started at a low point of $600,000 on 6 February 2026 and as of 19 April, approximately 73 days were in operation, with a maximum increase of 30.6 per cent (from $60,000 to $78,333). This round is characterized by long periods of time, complex structures and is currently being tested by critical time windows and price holding areas (e.g. $79,000-$80,600). If wave D is established and the currency price rebound is completed, the corresponding "E wave" adjustment is likely to occur。
2. BTC: DEEP ANALYSIS OF THE DYNAMIC STRUCTURE
BITCOIN 4 HOURS K LINE
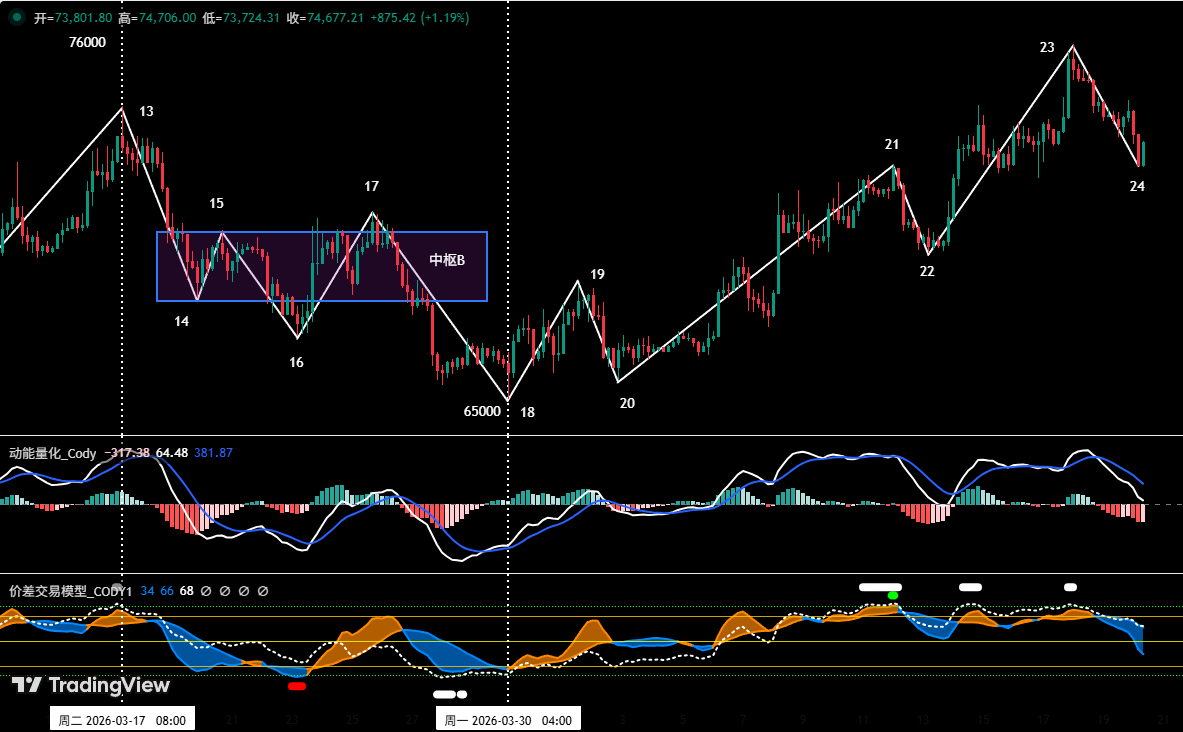
Figure III
• & nbsp; based on evolution after 30 march at a low point of $65,000。
• & nbsp; as shown (figure III), BTC has been operating since 30 March at a low point. From end 18 to end 24, there are 18 to 19, 19 to 20, 20 to 21, 1 to 22, 22 to 23, and 23 to 24, with a total structure of 6 paragraphs。
• & nbsp; showing from end 18 to end 23, rows are running a clearer 5 wave rebound structure and are currently running 23-24. we built it ourselvesPrice differential trading modelas you can see, there has been an ongoing high-alert warning signal (green spots in the picture, white points) in the recent past, which means that technical indicators are in a state of severe overpurchase and that there is short-term demand for shock adjustment in the market.
IV. Bitcoin forecast and operational strategy for this week
ONE, THE BTC PREDICTS THE MOVEMENT THIS WEEK:
• & nbsp; core views for the week:
It has been maintained at 73,500 to 79,000 United States dollars (US$) for inter-temporal shocks, with attention paid to competitions up and down. If the rebound breaks the upwards, the market will shake back, but space is limited; if the downwards line is effectively broken, the value of the currency may further explore the critical support around US$ 69,500。
Core pressure level:
& nbsp; & first pressure zone: us$ 79,000 ~ 80,600 & nbsp; (near november low point in 2025) & nbsp;
* second pressure zone: us$ 83,500 ~ 84,500 & nbsp; multi-empty-intensity bargaining area for prior periods) & nbsp;
3. Core support:
• second support position: us$ 69,500 near & nbsp; & nbsp; & nbsp; & & nbsp; & & nbsp; & & nbsp; & & & nbsp; & & & nbsp; & nbsp;
& nbsp; * supporting position: us$ 65,000-66,000 area & nbsp; near the down-orbit between the concussion zones
4. Operational strategy for the week (excludes the impact of breaking news): (04.20-04.26)
Medium-line strategy:
BITCOIN DAY K LINE MAP: (SILOT MONITORING MODEL)
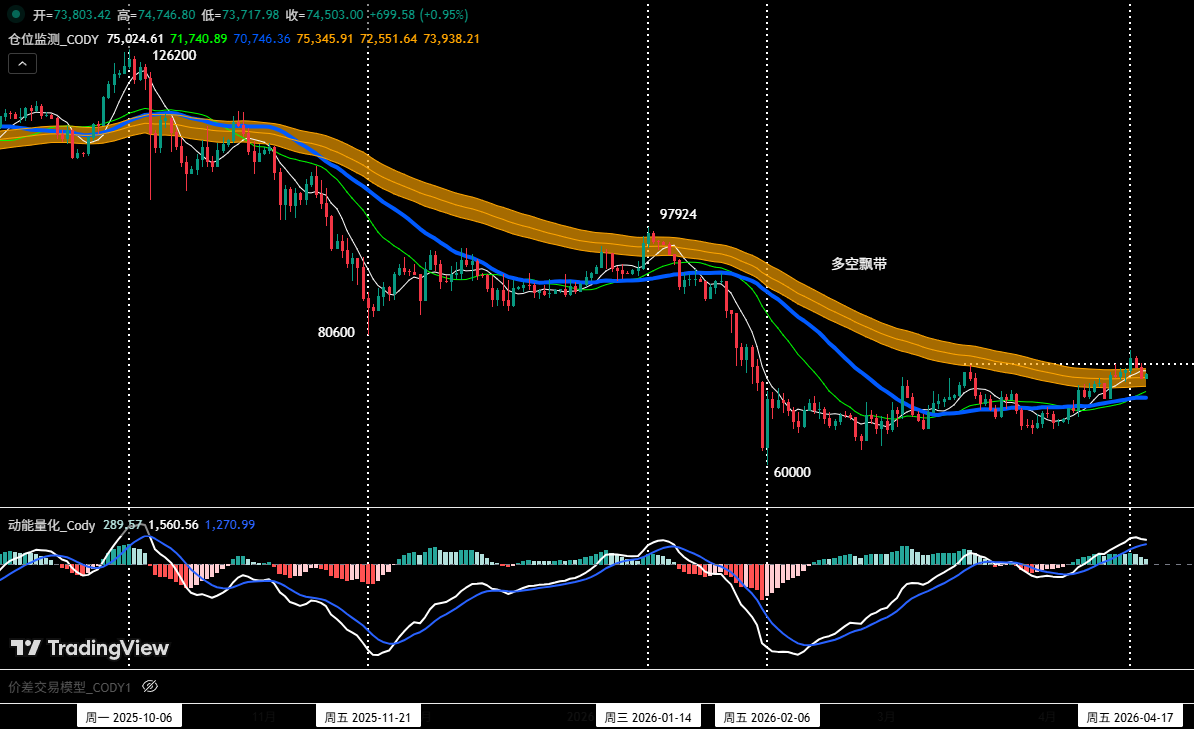
Figure IV
Warehousing monitoring model: As shown in figure IV, currency prices are currently convulsed near the multi-air belt. We're holding 60% of the empty warehouse space, based on strategic rules, for the time being at $89,000 (January 28th)。
• & nbsp; if the current week's currency rebound is valid enough to hold steady multiple air-dispersion belts, all mid-line positions will be cleared。
Short-line strategy: using 30% of warehouse slots, setting loss points, looking for work based on support and pressure levels“Performance difference”Opportunities. (30 minutes/60 minutes as operating period)。
3. Based on a prediction of mid-term market trends, the time has come to insist that "It's easyThe operating principles. We will develop a signal for dynamic responses to the complex evolution of markets and in conjunction with self-build trade modelsA/BTwo short-line operating scenarios:
•nbsp;OPTION A:We're in the middle of somethingI don't know。
& nbsp; & nbsp; & nbsp; & nbsp; & nbsp; & open: 30% empty warehouse slots can be created when the currency rebounds to us$ 76,500 to us$ 79,000 triggers a distress signal and joins the top of the model。
• wind control: initial stop position set above us$80,600。
& nbsp; & nbsp; & nbsp; & nbsp; & & nbsp; ) landmark: when the currency price falls near a critical support position and combines with a model signal, the silo can be gradually cleared for profit。
• & nbsp;OPTION B: BREAKING THE GAPI don't know。
& nbsp; & nbsp; & nbsp; & nbsp; & nbsp; & open: constant adjustment of the currency, supported near us$ 73,500 when the currency price falls effectively, and combined with a signal at the top of the model, can create 30% of the empty warehouse slot。
• wind control: the initial stop position is above usd 74,500。
& ) landmark: when it falls to a support position and combines with a model signal, the silo can come to a beneficial conclusion。
V. HYPE: OPERATION DUPLICATE
1. Short-line operational reviews:(see table I)
In strict compliance with the operational prognosis, we completed a short-line (multiple) operation last week, based on trade signals from the self-built price differential trade model and the kinetic energy quantification model, with a cumulative turnover of 6.80 per cent。
SUMMARY OF SHORT-TERM TRANSACTIONS:(leveraging*1 times)
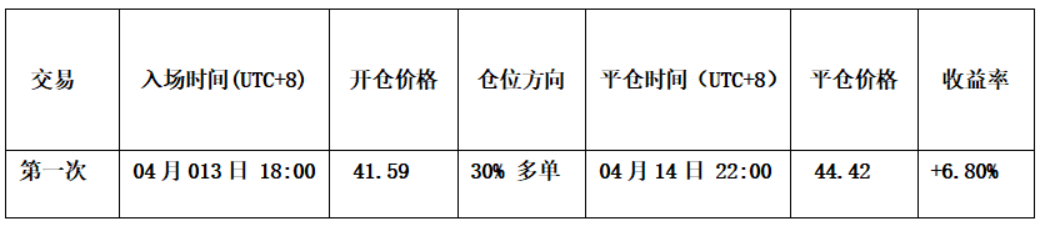
Table I
3. Short-term transaction double:(see figure V)
• & nbsp; silo strategy: first based on a judgement of the upward trend of the V wave in the market; second price differential trade model has sent a warning signal at the bottom (better in the picture); two kinetic energy lines in a second kinetic energy model are running at the top of the zero axis, and two models send a resonance signal. At 41.59, we created more than 30% of the silos。
• & nbsp; silicon strategy: when prices rise to $45, the price difference trade model triggers a strong top warning signal (green + white point), so we clear all the warehouses around 44.42 dollars。
• & nbsp; summary: this transaction has a profit of about 6.80%。
HYPE 60 MIN K LINE:Dynamic Energy QuantificationModel+Price differential transactionsModel)
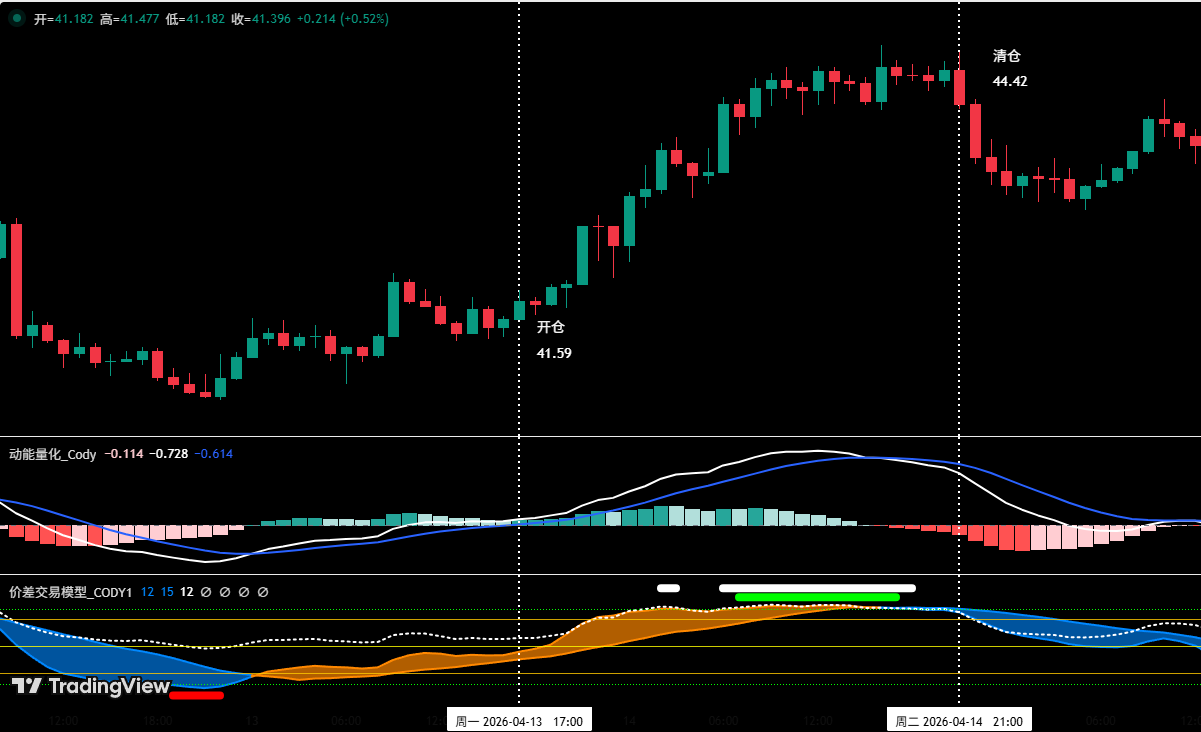
Figure V (short-line trade diagrams)
VI. Special reminders:
& nbsp; 1. at warehouse: set the initial stop position immediately。
& nbsp; 2. when profit reaches 1%: move the loss position to the opening cost (gain/loss balance point) to ensure security of principal。
& nbsp; 3. when profit reaches 2%: move loss position to 1% profit position。
& nbsp;4. continuous tracking: every 1% of the value of the currency thereafter, the loss will move simultaneously 1%, dynamically protected and locked
Financial markets are rapidly changing and all situation analyses and trading strategies need to be adjusted dynamically. All the views, analytical models and operational strategies addressed in this paper are derived from individual technical analysis and are used only by the individual transaction log and do not constitute any investment proposal or operational basis. Markets are risky and investments need to be prudent and do not make decisions on this basis。
