
Bitcoin's weak shock.
Market participants are preparing for volatile events with a downward bias. 。

Original by Chris Beamish, CriptoVizArt, Antoine Colpaert, Glassnode
Photo by Aididiao JP, Foresigt News
BITCOIN REMAINS TRAPPED IN A FRAGILE ZONE, WITH HIGHER UNREALIZED LOSSES, LONG-TERM HOLDERS SELLING AND CONTINUED WEAK DEMAND. ETF AND LIQUIDITY REMAIN WEAK, FUTURES MARKETS WEAK AND OPTIONS TRADERS ARE PRICING SHORT-TERM VOLATILITY. THE MARKET IS NOW STABLE, BUT CONFIDENCE IS STILL LACKING。
Summary
Bitcoin remains structurally fragile, under pressure from an increase in unrealized losses, higher realized losses and substantial profits for long-term holders. Nevertheless, demand anchors prices above real market averages。
The failure of markets to regain key thresholds, especially the short-term holder cost base, reflects the continuing pressure of recent high buyers and senior holders to sell. It is possible to retest these levels in the short term if sellers show signs of depletion。
UNDERLINK INDICATORS REMAIN WEAK. ETF HAS NEGATIVE FINANCIAL FLOWS, LOW SPOT LIQUIDITY, AND FUTURES HOLD-OUTS SHOW INSUFFICIENT SPECULATIVE CONFIDENCE, MAKING PRICES MORE SENSITIVE TO MACROCATALYSTS。
THE OPTIONS MARKET SHOWS A DEFENSIVE LAYOUT, WITH TRADERS BUYING SHORT-TERM IMPLIED VOLATILITY (IV) AND CONTINUING DEMAND FOR LOWER PROTECTION. VOLATILE CURVATURE SIGNALS SHOW SHORT-TERM CAUTION, BUT LONGER-TERM EMOTIONS ARE MORE BALANCED。
WITH THE FOMC MEETING AS THE LAST MAJOR CATALYST FOR THE YEAR, IMPLIED FLUCTUATIONS ARE EXPECTED TO DECLINE IN LATE DECEMBER. THE DIRECTION OF THE MARKET DEPENDS ON WHETHER LIQUIDITY IMPROVES AND THE SELLER STOPS, OR WHETHER THE CURRENT TIME-DRIVEN DOWNWARD PRESSURE WILL CONTINUE。
Insight on the chain
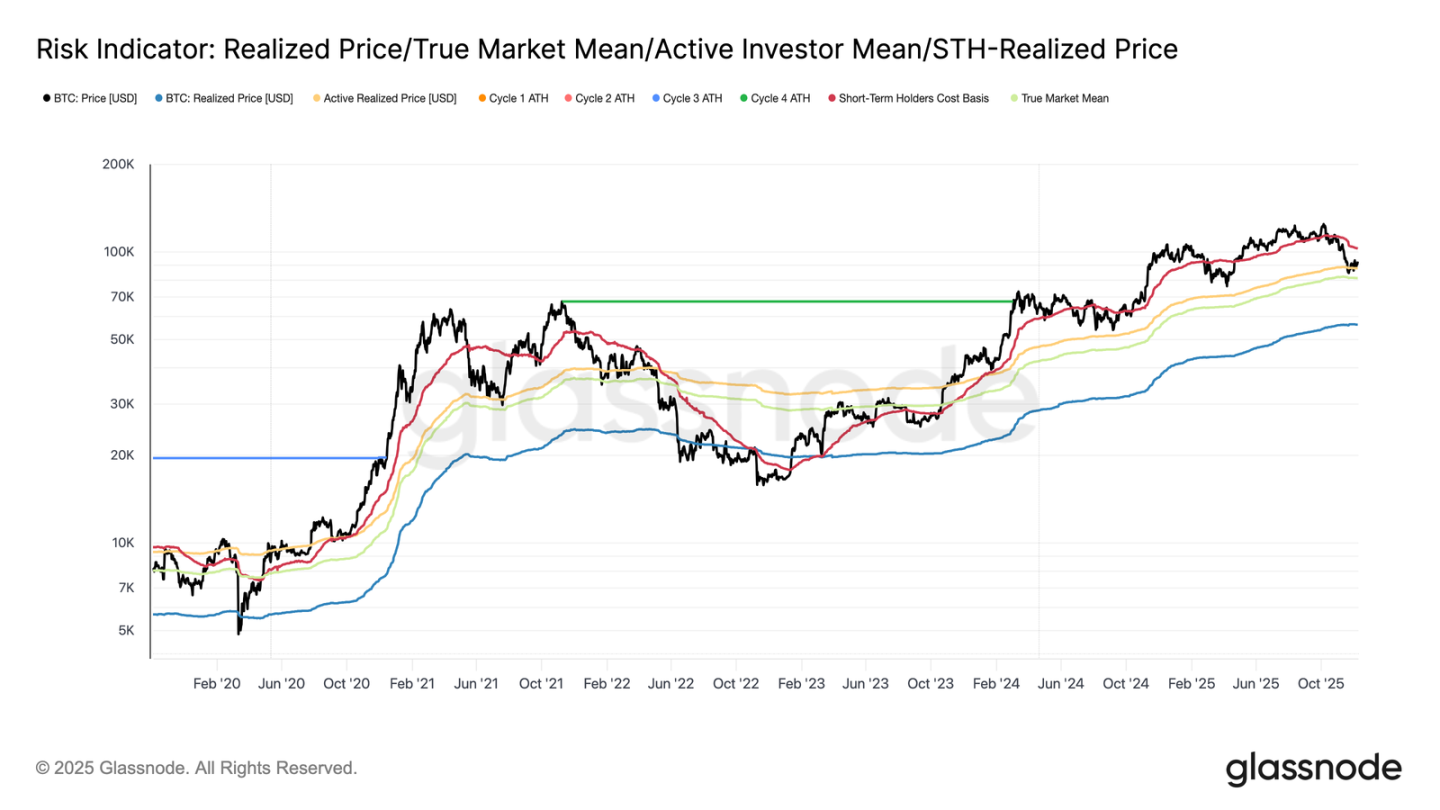
Bitcoin entered the week in structurally vulnerable zones, with the upper boundary being the short-term holder cost base ($10.27 million) and the lower boundary being the real market average ($8.13 million). Last week, we highlighted the weakening of the chain, low demand and prudent derivative patterns, which collectively echoed the market pattern of early 2022。
While prices barely remained above real market averages, unrealized losses continued to grow, realized losses were rising and long-term investor spending remained high. The key ceiling to be recovered is 0.75 on the cost base score ($95,000), followed by the short-term holder cost base. Until then, the real market average remained the most likely bottom-forming region, unless there was a new macro shock。
Time is bad for many
Markets remain at a moderate stage of decline, reflecting the tension between moderate capital inflows and continued pressure from high-level buyers to sell. As the market hovers within a weak, but limited, zone, time becomes a negative force, making it more difficult for investors to absorb unrealized losses and increasing the likelihood of realizing them。
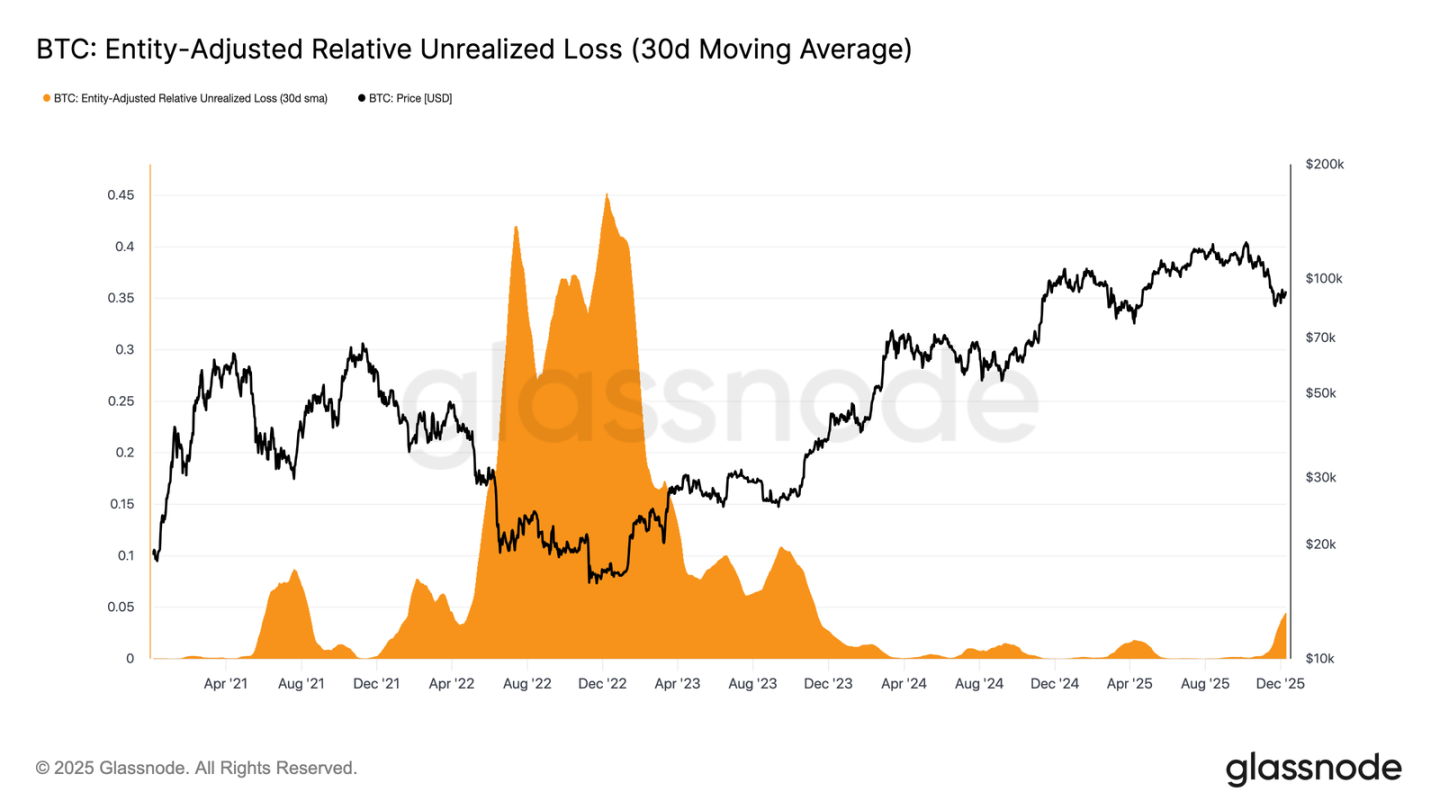
The relative unrealized losses (30 days of simple moving averages) have climbed to 4.4 per cent, after having been below 2 per cent for almost two years, marking a shift from a period of fanaticism to one of increased pressure and uncertainty. This hesitation now defines the price band, and addressing it requires a new round of liquidity and demand to rebuild confidence。
Increase in losses
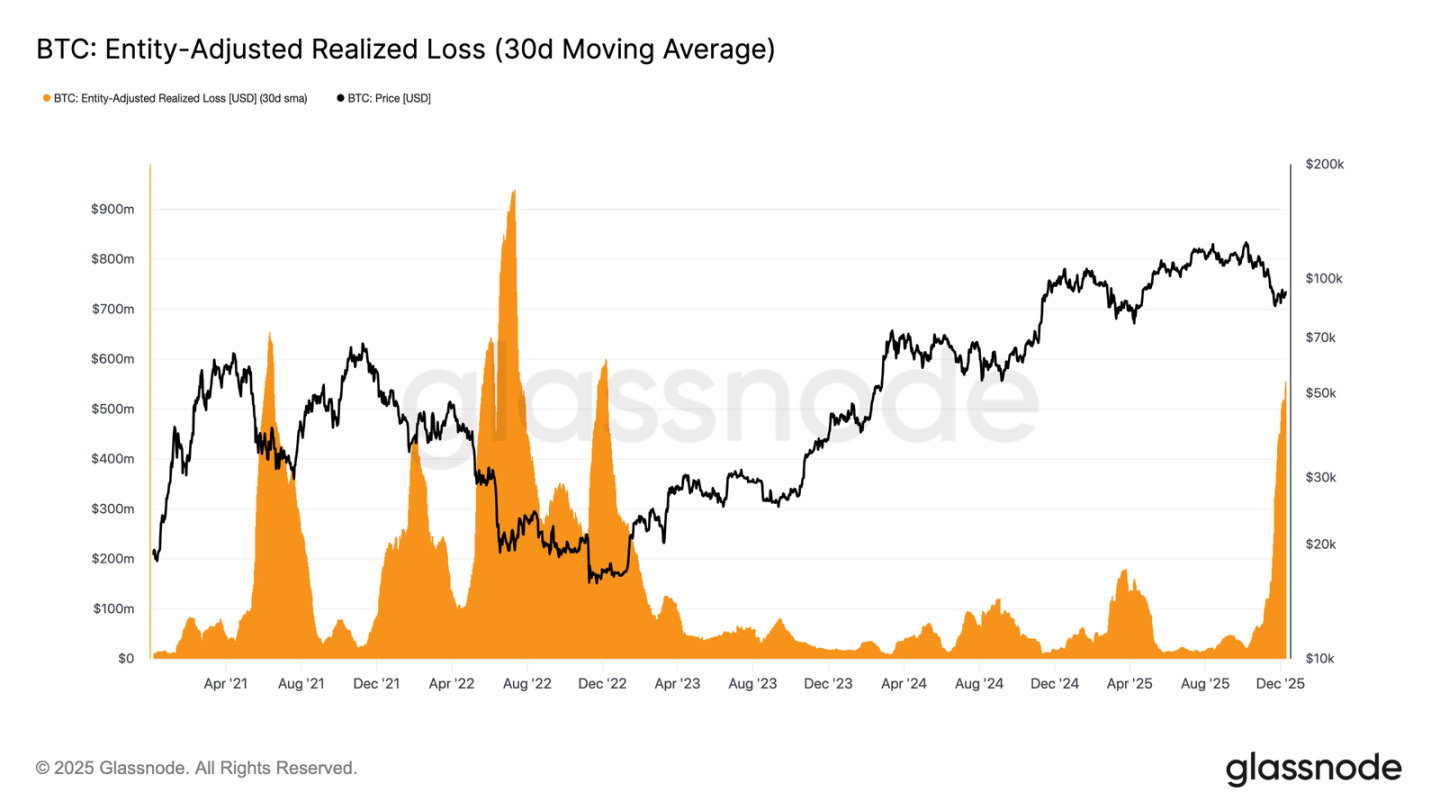
THIS TIME-DRIVEN PRESSURE IS MORE EVIDENT IN EXPENDITURE BEHAVIOUR. ALTHOUGH BITCOIN HAS REBOUNDED FROM ITS LOW POINT ON 22 NOVEMBER TO ABOUT $9.27 MILLION, 30 SIMPLE MOVING AVERAGE LINE PHYSICAL ADJUSTMENTS HAVE RESULTED IN SUSTAINED LOSSES CLIMBING TO $555 MILLION PER DAY, THE HIGHEST LEVEL SINCE THE FTX COLLAPSE。
The realization of such high losses during the moderate recovery in prices reflects the growing frustration of high-level buyers who choose to surrender when markets are strong rather than hold back。
Obstructing Reverse
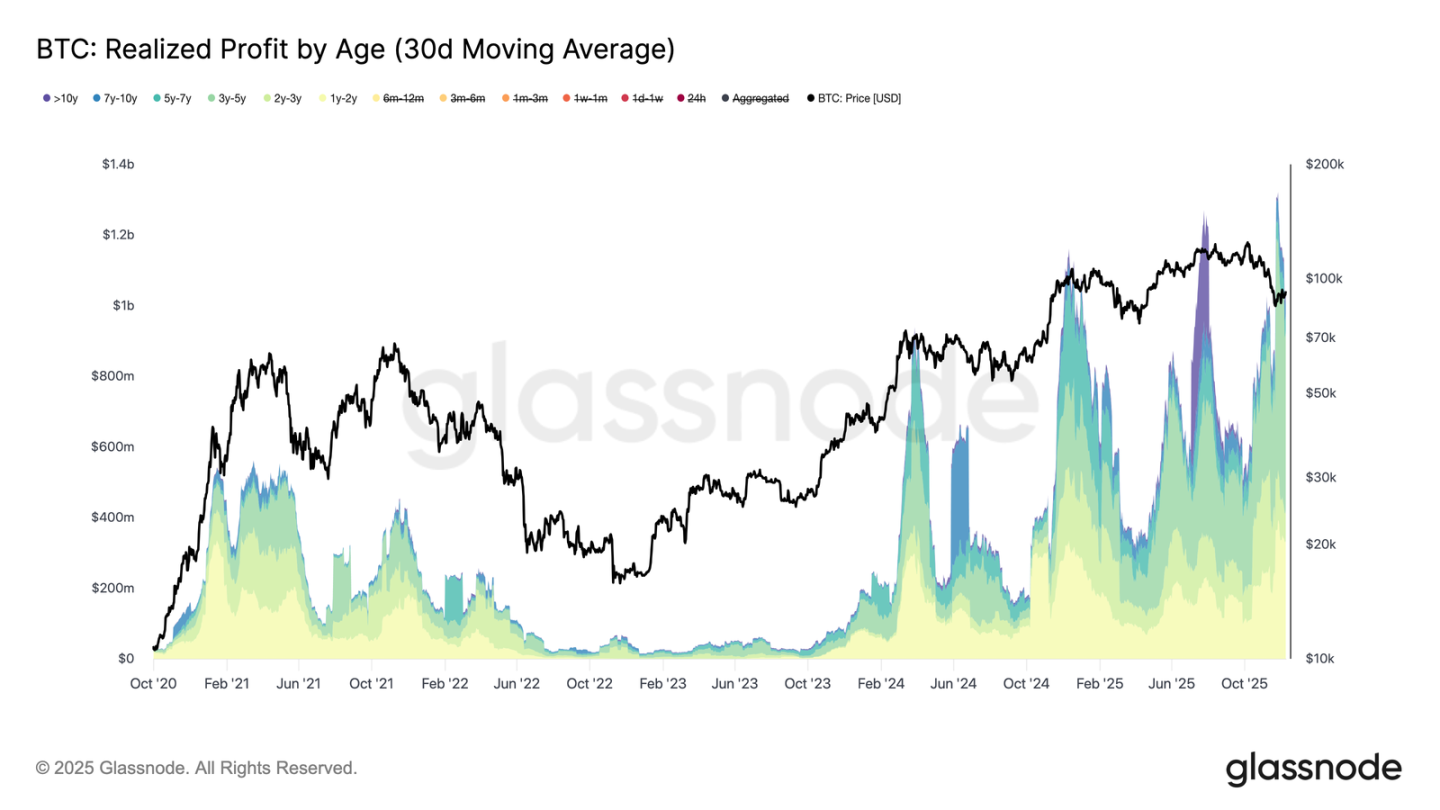
The recovery has been further hampered by the realized rise in losses, especially when they coincide with the surge in profits achieved by senior investors. In the recent rebound, the realized profits of more than one year of holders (30 days of simple moving averages) exceeded $1 billion per day and peaked at over $1.3 billion at new historical heights. These two forces-driven high-level buyers have ended up surrendering and the large-scale profits of long-term holders, explaining why the market is still trying to recover the cost base of short-term holders。
However, despite such enormous pressure on sales, prices have stabilized or even recovered to real market values, indicating that persistent and patient demand is absorbing sales. If sellers begin to dry up in the short term, this potential buying pressure may facilitate a retest of 0.75 places (approximately $95,000) or even the short-term holder cost base。
Underlink Insight
ETF DISTRESS
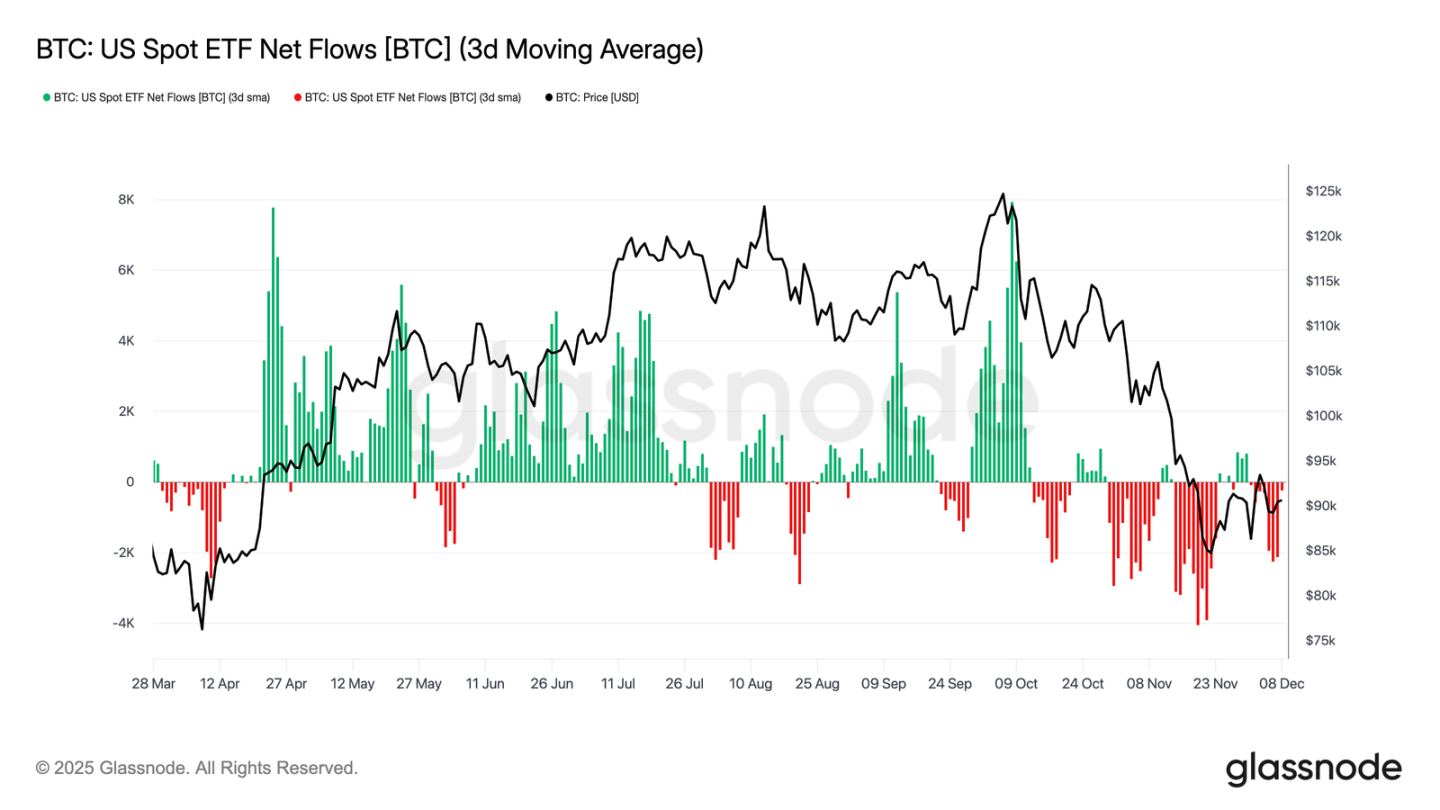
TURNING TO THE SPOT MARKET, THE UNITED STATES BITCOIN ETF SPENT ANOTHER CALM WEEK, WITH THREE DAYS OF AVERAGE NET INFLOWS CONTINUING NEGATIVE. THIS FOLLOWS THE COOLING TREND THAT BEGAN IN LATE NOVEMBER AND MARKS A MARKED DEPARTURE FROM THE STRONG INFLOW MECHANISMS THAT UNDERPINNED THE PRICE RISE EARLIER THIS YEAR. THE MANY MAJOR ISSUERS ' REDEMPTIONS REMAINED STABLE, HIGHLIGHTING THE MORE RISK-AVERSE POSITION TAKEN BY THE AGENCY ' S CONFIGURATIONS AT A TIME OF GREATER MARKET UNCERTAINTY。
As a result, demand buffers in spot markets have become thinner, reducing immediate buyer support and making prices more vulnerable to macro-catalysts and volatile shocks。
Liquidity is still low
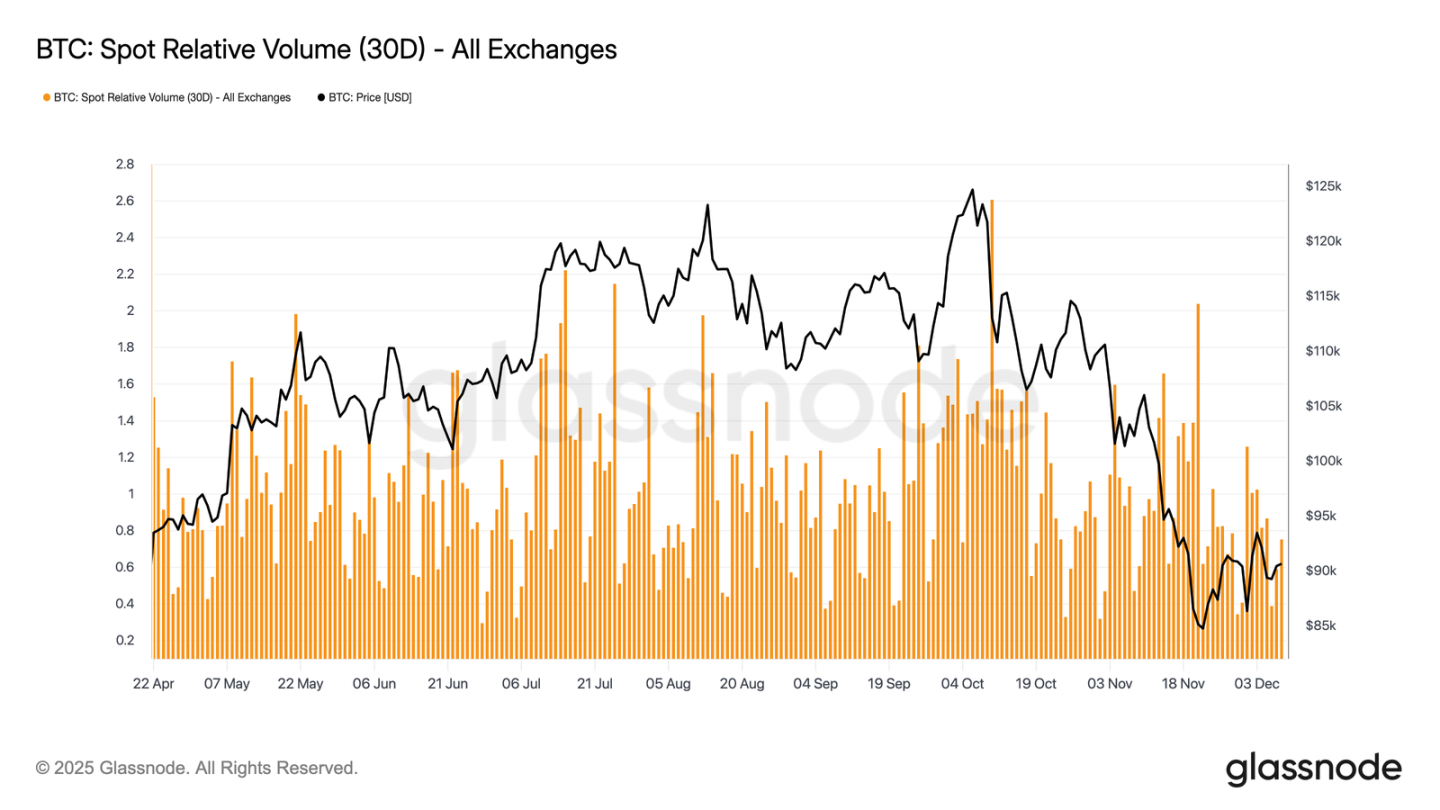
IN PARALLEL TO THE WEAKNESS OF THE ETF FINANCIAL FLOW, THE SPOT OF BITCOIN CONTINUES TO BE NEAR ITS LOWER LIMIT BETWEEN 30 DAYS. TRANSACTION ACTIVITY CONTINUED TO WEAKEN FROM NOVEMBER TO DECEMBER, REFLECTING FALLING PRICES AND DECLINING MARKET PARTICIPATION. THE CONTRACTION OF THE TURNOVER REFLECTS A MORE DEFENSIVE POSITIONING OF THE MARKET AS A WHOLE, WHICH CAN BE USED TO ABSORB VOLATILITY OR SUSTAIN A REDUCTION IN LIQUIDITY-DRIVEN FLOWS。
AS THE SPOT MARKET CALMED, ATTENTION NOW TURNED TO THE UPCOMING FOMC MEETING, WHICH, ACCORDING TO ITS POLICY TONE, COULD BECOME A CATALYST FOR REACTIVATING MARKET PARTICIPATION。
The futures market is low
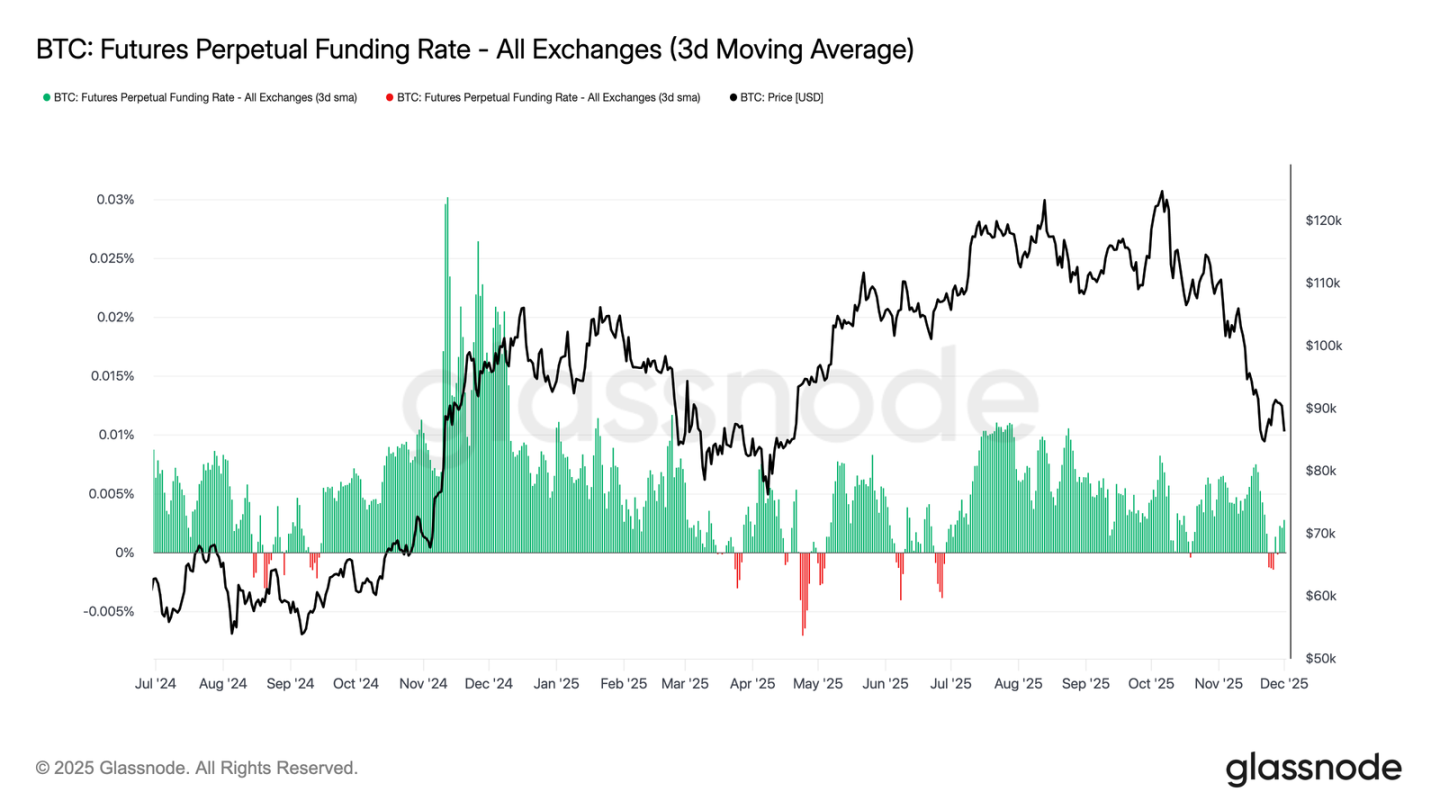
Continuing the theme of low market participation, futures markets have also shown limited interest in leverage, incomplete contracts have not been substantially rebuilt and financial rates have remained near neutral. These developments highlight a derivative environment defined by caution rather than confidence。
In the sustainable contract market, the current week ' s funding rate hovered from zero to slightly negative, highlighting the continuing withdrawal of speculative multiple positions. Trading agents maintain a balanced or defensive posture, with little leverage for directional pressure。
Because of low derivative activity, prices have found a preference for spot flows and macrocatalysts rather than speculative expansion。
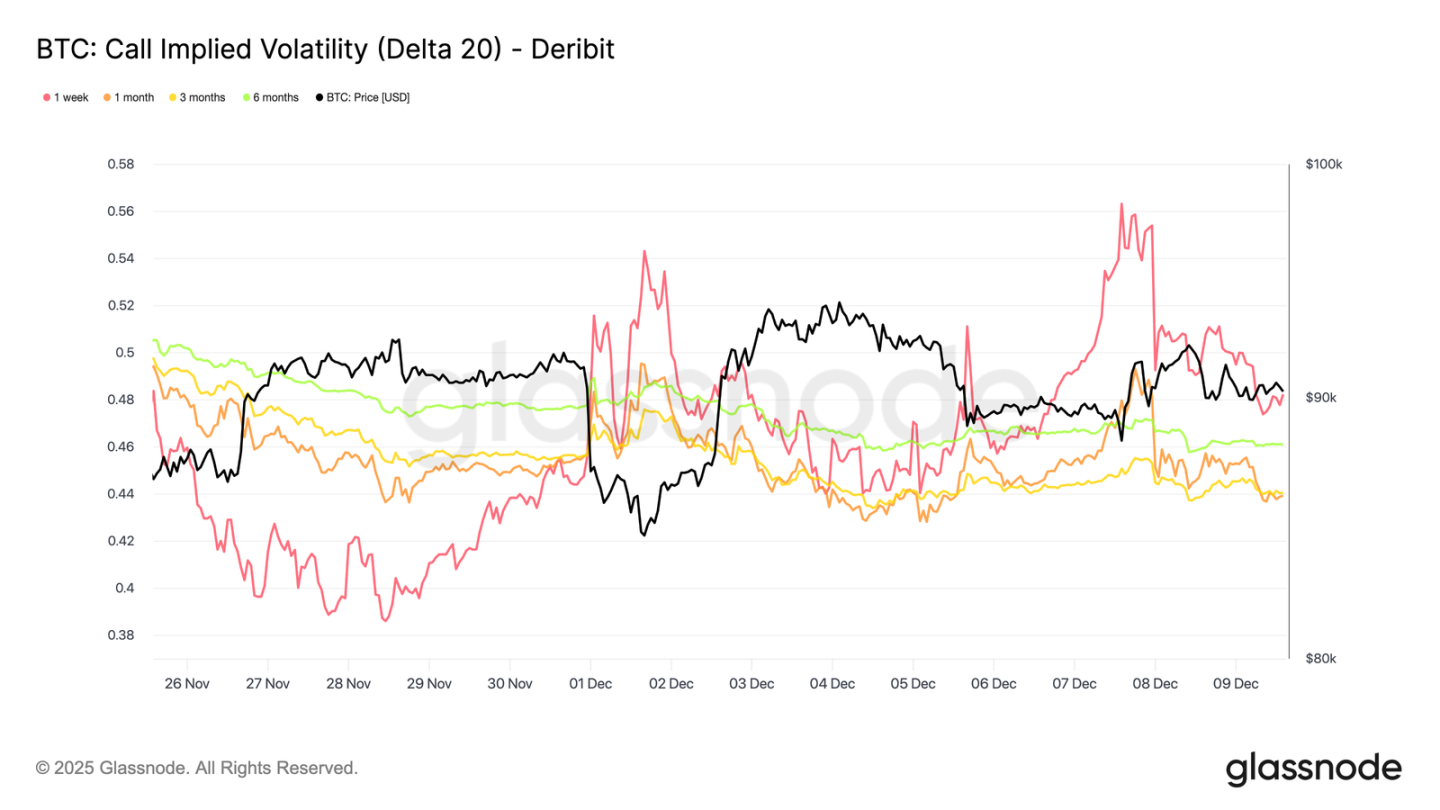
Short-term implied fluctuations surged
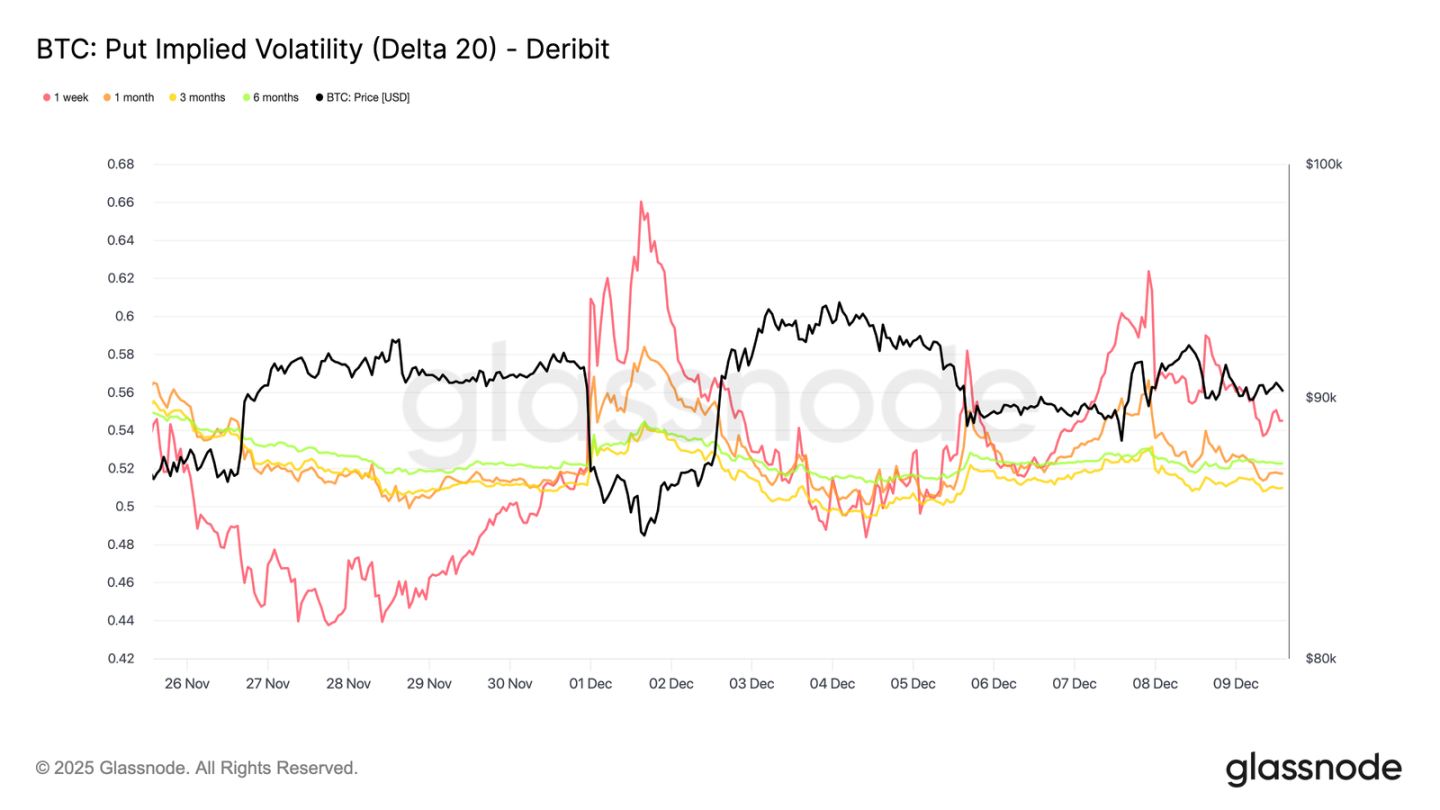
Turning to the options market, the flat spot activity of bitcoin contrasts sharply with the sudden rise in short-term implied volatility, and traders are setting up larger price movements. Implicit volatility of the plug (calculated by fixing Delta values rather than relying on marketable right prices) reveals more clearly the pricing structure of risks over different time periods。
In 20-Delta, the week-long IV increased by about 10 volatility points over the last week, while the longer term remained relatively stable. The same pattern appears in 20-Delta, falling options, going down IV in the short term and remaining calm for longer periods。
IN GENERAL, TRADERS ARE ACCUMULATING FLUCTUATIONS IN THEIR EXPECTED PRESSURES, PREFERRING TO HOLD A HIGH PROFILE RATHER THAN SELL THEM BEFORE THE DECEMBER 10TH FOMC MEETING。
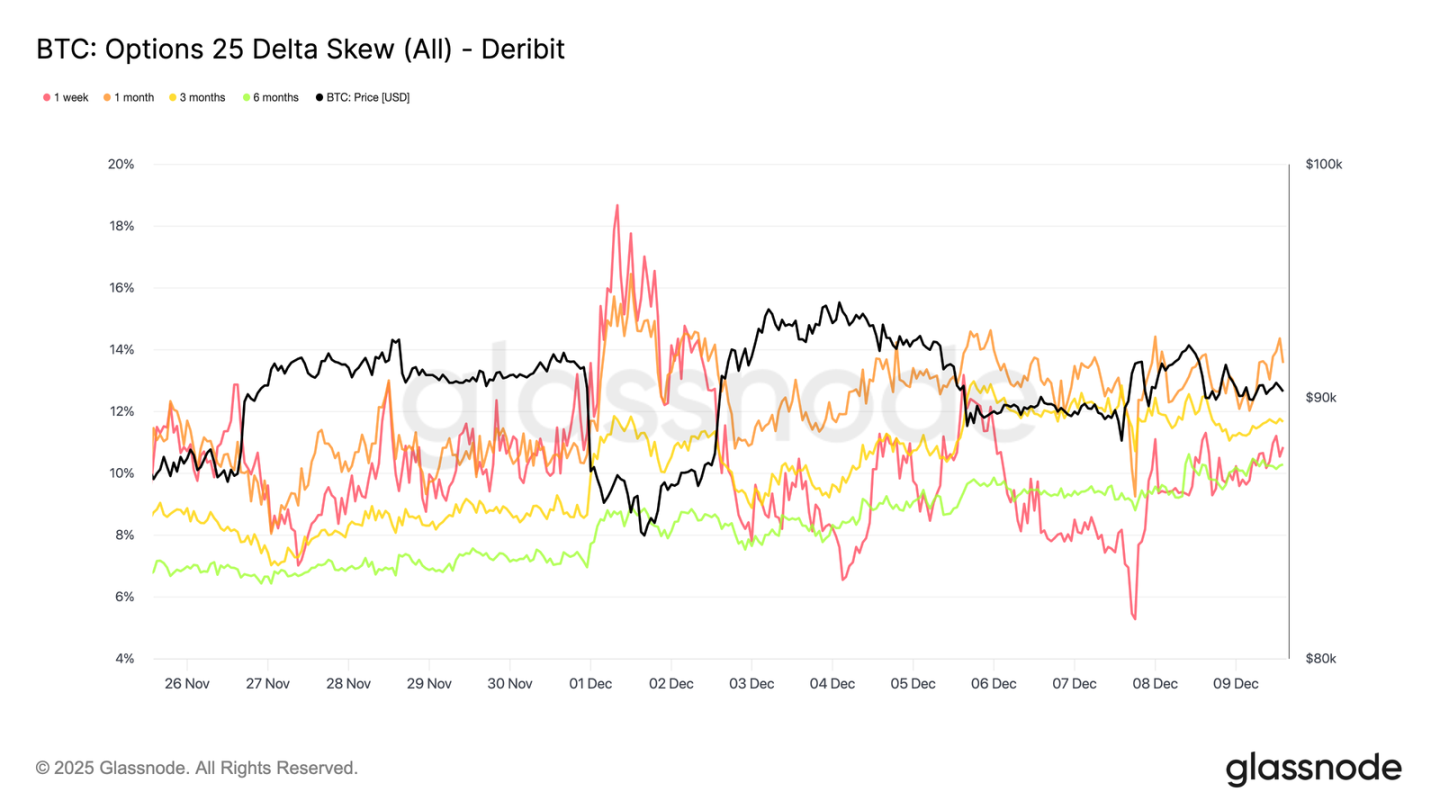
Downward demand returns
In line with the increase in short-term fluctuations, downside protection is again premiumed. The 25-delta bias against the relative cost of rising options measured at the same Delta values has climbed to about 11 per cent over the one-week period, indicating a significant increase in the demand for short-term downside insurance before the FOMC meeting。
The degree of bias is closely concentrated over time periods ranging from 10.3 to 13.6 per cent. This compression indicates that the preference for look-and-see protection is curve-wide and reflects a consistent risk-averse tendency rather than isolated pressures limited to the short-term end。
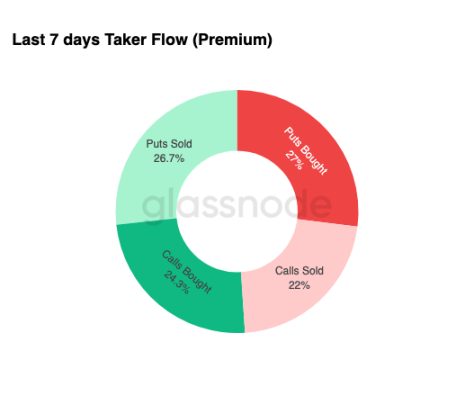
Volatility accumulation
Summarizing the situation in the market for options, weekly capital flow data reinforce a clear pattern: traders are buying in volatility rather than selling. Purchases of options have dominated the total nominal financial flows, with a slight lead in terms of falling options. This does not reflect directional bias, but rather the accumulation of volatility. When traders buy both options at the same time, the signal is a pair of hedges and aggressive behaviour, not emotional speculation。
Combined with rising implied volatility and downward bias, financial flows indicate that market participants are preparing for volatile events with a downward bias。
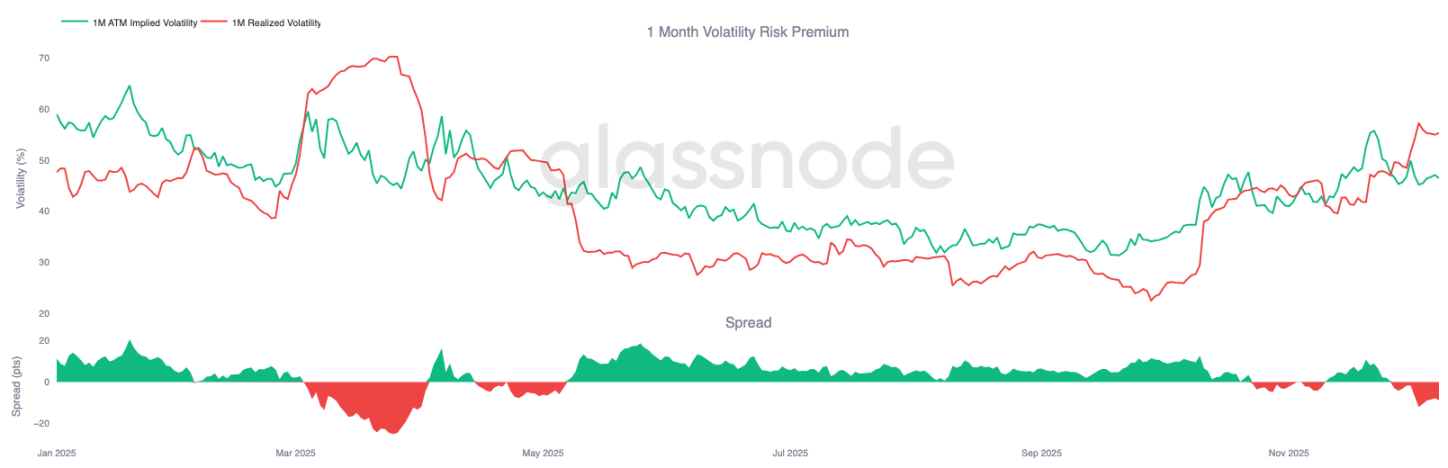
AFTER FOMC
LOOKING AHEAD, IMPLIED VOLATILITY HAS BEGUN TO SUBSIDE AND, HISTORICALLY, ONCE THE LAST MAJOR MACRO EVENT IN THE YEAR HAS PASSED, IV TENDS TO CONTRACT FURTHER. WITH THE FOMC MEETING ON 10 DECEMBER AS THE LAST MEANINGFUL CATALYST, THE MARKET IS PREPARING TO TRANSITION TO A LOW-MOBILITY, AVERAGE RETURN ENVIRONMENT。
FOLLOWING THE PUBLICATION OF THE BULLETIN, THE SELLER USUALLY RE-ENTERS THE SITE AND ACCELERATES THE DECLINE OF IV BEFORE THE END OF THE YEAR. IN THE ABSENCE OF AN UNEXPECTED OR SIGNIFICANT SHIFT IN HAWK DIRECTION, THE MINIMUM RESISTANCE PATH POINTS TO LOWER IMPLIED VOLATILITY AND MORE FLAT VOLATILITY CURVES AND CONTINUES UNTIL LATE DECEMBER。
Conclusions
Bitcoin continues to be traded in a structurally fragile environment, with rising unrealized losses, high realized losses and large profits from long-term holders ending the price trend. Despite continuing sales pressure, demand remains resilient enough to keep prices above real market averages, indicating that patient buyers continue to absorb sales. If signs of vendor depletion begin to appear, it is still possible to advance the cost base from $95,000 to $95,000 for short-term holders in the short term。
UNDER-CHAIN CONDITIONS ECHO THIS CAUTIOUS TONE. ETF FINANCIAL FLOWS REMAIN NEGATIVE, SPOT LIQUIDITY IS WEAK AND FUTURES MARKETS LACK SPECULATIVE PARTICIPATION. THE OPTIONS MARKET REINFORCED DEFENSIVE POSTURES, TRADERS ACCUMULATED VOLATILITY, BOUGHT SHORT-TERM DOWNSIDE PROTECTION, AND PRE-FOMC ARRANGEMENTS FOR RECENT VOLATILITY EVENTS。
Taken together, the market structure shows that it is a weak but stable zone, supported by patient demand but constrained by constant pressure to sell. The short-term path depends on improved liquidity and the closure of vendors, while the long-term outlook depends on the market regaining the critical cost base threshold and moving beyond this time-driven and stressful phase。
